
U.S. Apartment Market
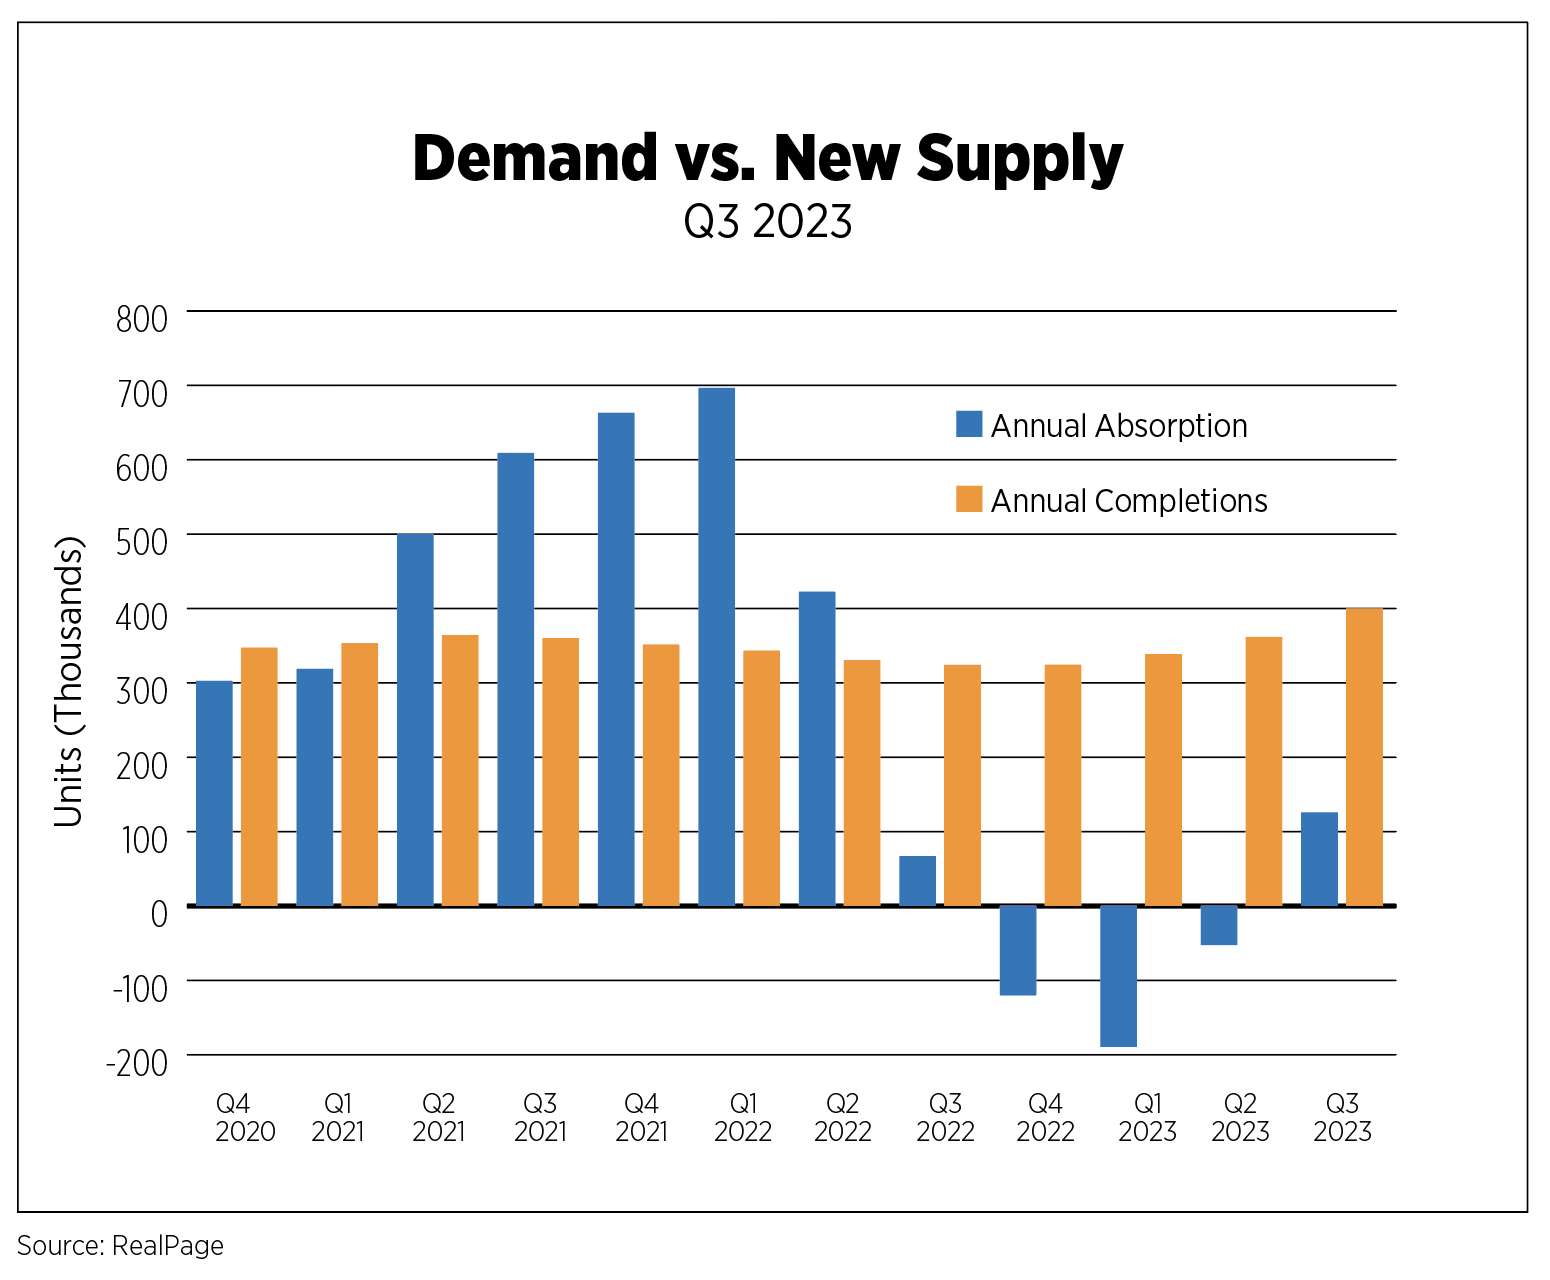
For the first time since Q3 2022, annual absorption was positive, signaling strong demand, with 127,130 units absorbed, according to RealPage. Quarterly market absorption rose to 90,827 units. Despite this positive growth, demand is still falling short of new completions. New supply surged to the highest level in over 30 years, totaling an annual value of 405,367 units, which is 76,764 units more than the year-ending value in 2022. This huge inflow of supply has shifted the balance of power in the market to renters due to the availability of alternatives, as well as generous concessions in some markets.
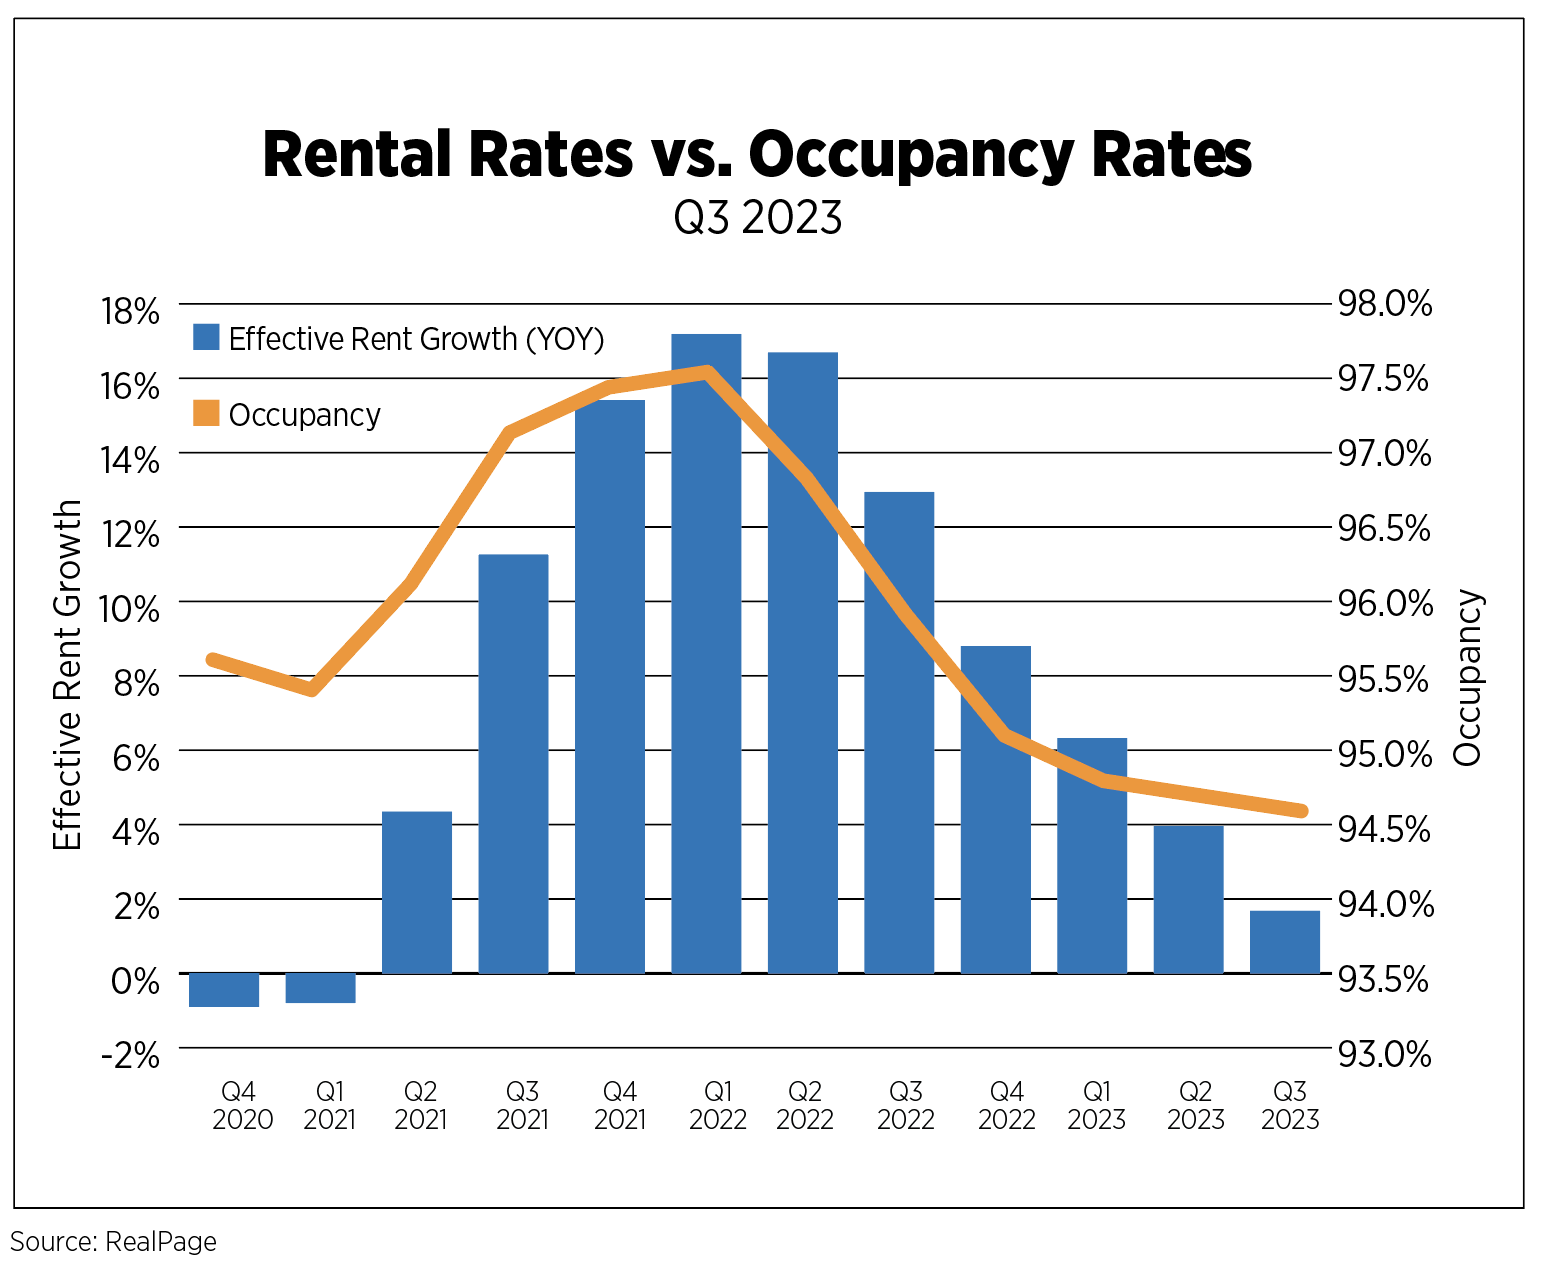
As supply rose, effective rent growth moderated. Year-on-year effective rent growth has been decelerating since Q2 2022, rising just 1.7% in Q3 2023. Similarly, the occupancy rate has been on a consistent decline for six consecutive quarters since its highest level in Q1 2022 at 97.5% and has experienced a cumulative drop of 300 basis points.
On a national level, the data displayed a fall in rent growth in the West and South regions of the country and a consistent rise in the Northeast and Midwest regions. Rents have declined in over half of the nation’s 50 metro areas, with the highest-ranking rent cuts occurring in four major markets: Austin, Phoenix, Las Vegas and Jacksonville, Fla.
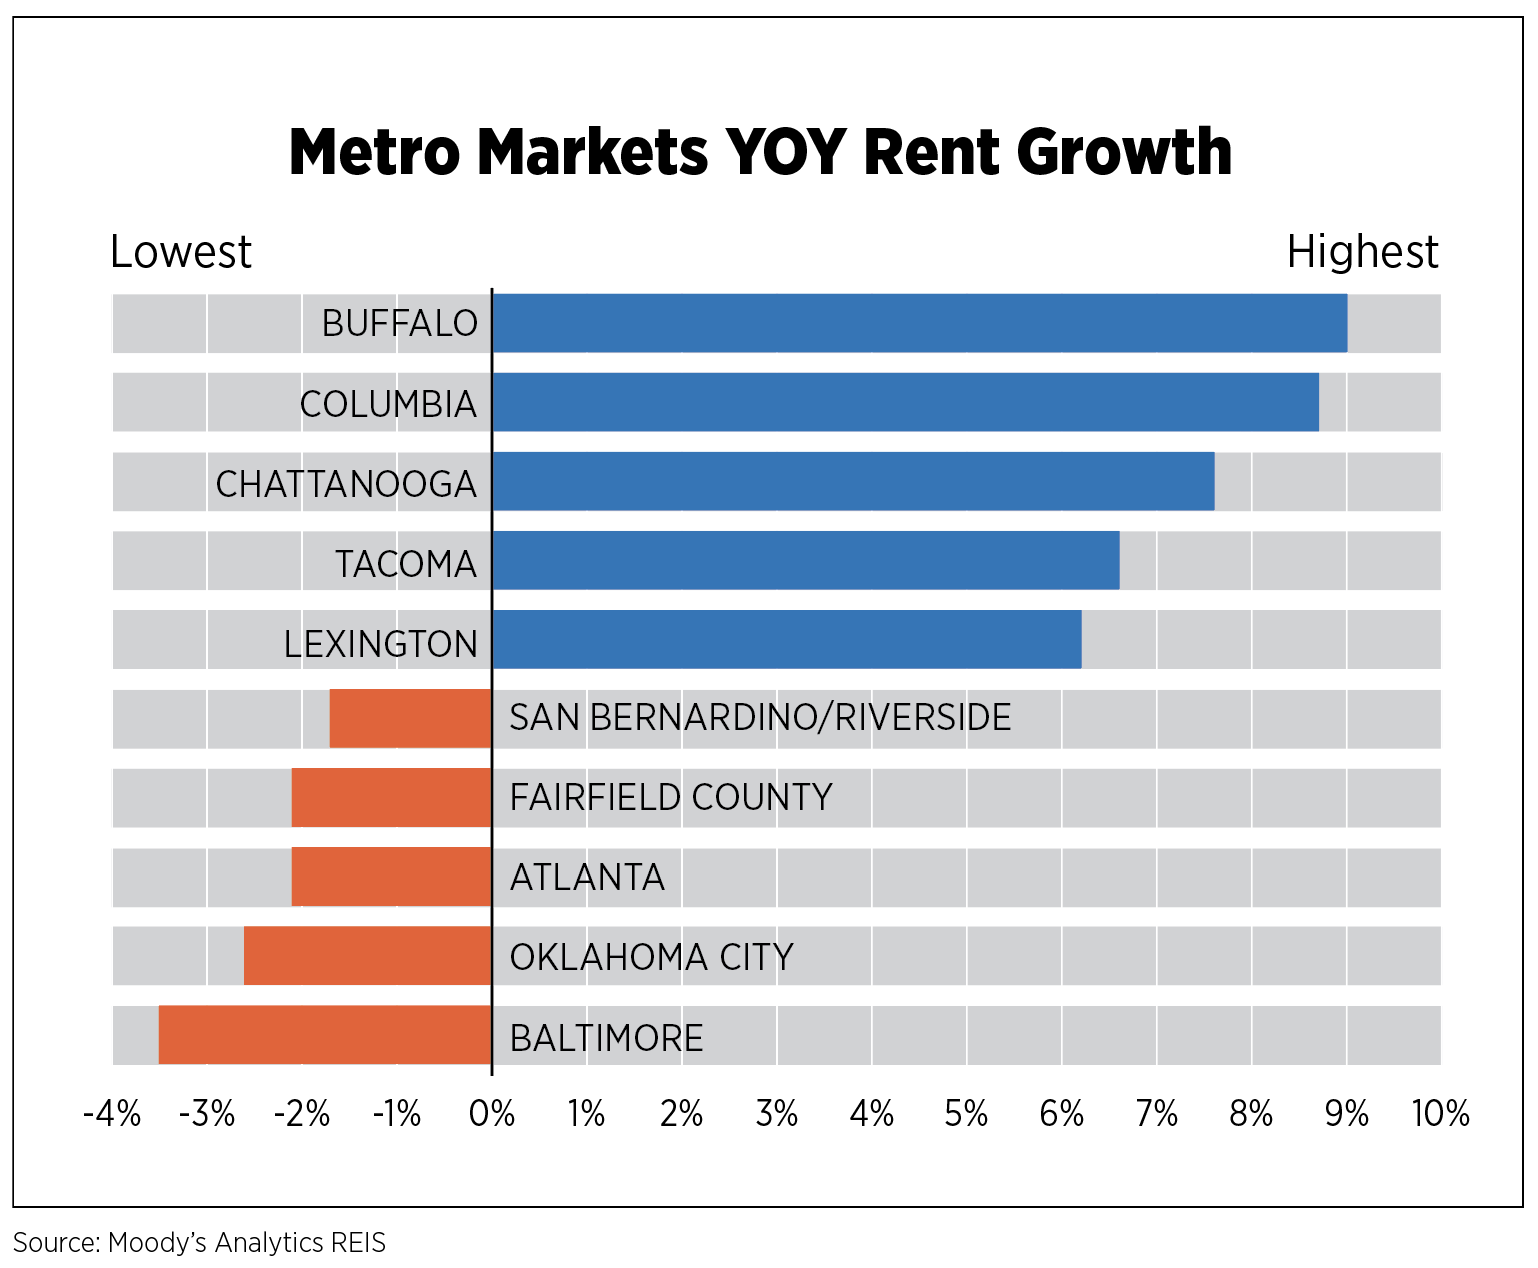
Metro-level data derived from the Moody’s Analytics REIS dataset provided insights on vacancy rates and 12-month effective rent growth for a variety of markets, with some of them experiencing high levels of rent growth. Buffalo, N.Y. (9%); Columbia, S.C. (8.7%); Chattanooga, Tenn. (7.6%); Tacoma, Wash. (6.6%); and Lexington, Ky. (6.2%), were the top five markets with the highest rent growth levels. Nevertheless, a few markets experienced a decline in rent relative to the prior year, with the top three declines observed in the following markets: Baltimore, Oklahoma City, Okla., and Atlanta.
Vacancy rates, in Q3 specifically, ranged from as low as 1.3% (in Central New Jersey) to as high as 8.3% (in the District of Columbia). Vacancy rates have been on the rise as new supply continued to outstrip demand. At the end of Q3 2023, reports from REIS illustrated a national increase of 0.2 percentage points year-over-year, with the largest increases in vacancy observed in the following markets: Nashville, Tenn., Austin, San Antonio and Phoenix. Nonetheless, vacancy rates fell in 27 of 79 metro markets tracked by REIS.
U.S. Capital Markets
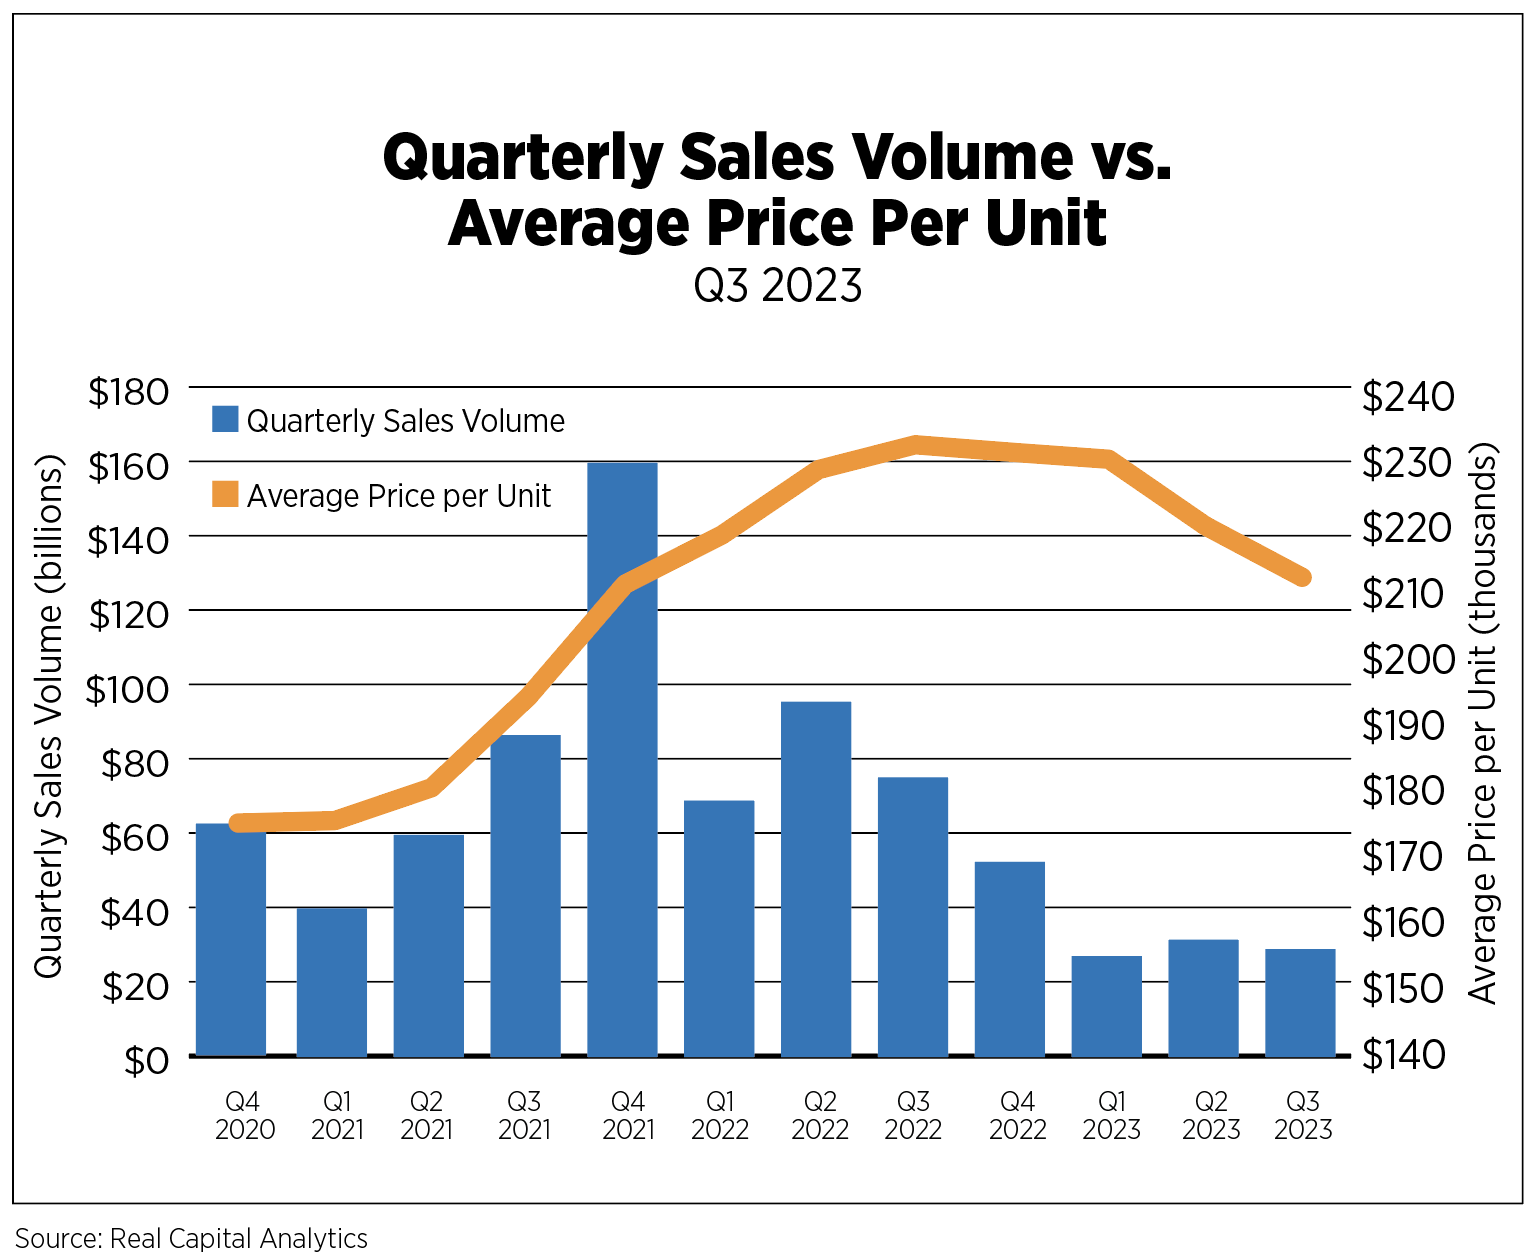
According to Real Capital Analytics (RCA), apartment sales volume in Q3 2023 was recorded at $29.1 billion, decreasing by 62% year-over-year, partially due to fewer portfolio sales. The volume of sales has dropped astronomically from its peak of over $161 billion as at Q4 2021, which can be attributed to ripple effects of rising interest rates, lack of financing and pricing mismatches between buyers and sellers.
The average price per unit for properties in Q3 2023 was recorded at $212,185, representing about a 9% decline from Q3 2022. The average cap rate rose to 5.3%, which was a 20-basis point increase from the preceding quarter and a 60-basis point increase from the year before, indicative of price pressures and increased market risk.
U.S. Build-to-Rent Market
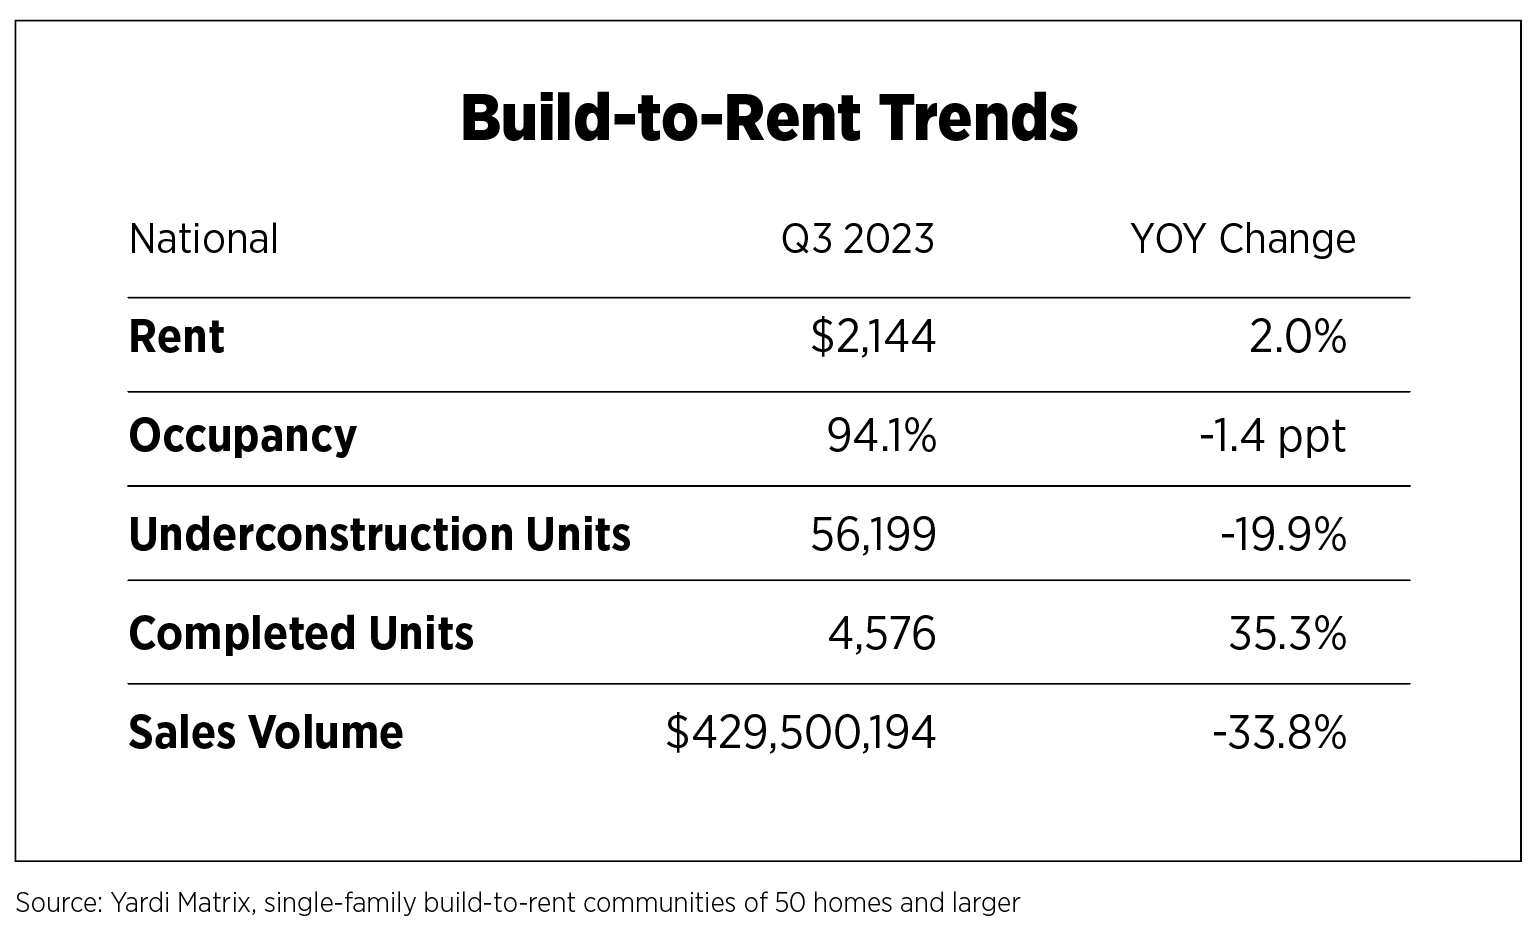
The single-family build-to-rent (BTR) trend report provided by Yardi depicted a consistent increase in effective rent on a national level, amounting to $2,144 in Q3 2023. Overall, rent has grown by about 200-basis points from the same time last year and by 28% since Q3 2020. However, some markets had a significant decline in rent growth from the preceding year: Carolina Triangle, N.C. (6.7%), Scranton-Wilkes Barre, Pa. (6.4%), Miami (6.4%), Hattiesburg, Miss. (5.8%), and Huntsville, Ala. (5.2%).
Housing units under construction in the market have been steadily decreasing since the start of the year. The value dropped to about 56,000 units from a peak of over 70,000 units in the same quarter of the previous year.
Over 4,500 units were completed in the third quarter. Although completed units decreased by about 970 units from the previous quarter, the occupancy rate remained constant at 94.1%, which is the lowest level since its peak of 97% in Q3 2021. The markets that had the highest number of completed units were Phoenix (812), Salt Lake City (331), Suburban Atlanta (288) and Charleston (254).
Transaction volume rose to its highest point of the year at over $429.5 million, which is 46.6% higher than its value in Q1 2023 and about 70% higher than its value in Q2 2023. Despite its rise from the previous two quarters, sales volume is still far beneath its peak point in Q4 2021 at over $1.3 billion.
U.S. Economy
The economy continued its rollercoaster ride with negative readings on several recently released economic indicators. Inflation has ticked up, largely driven by increases in energy prices; mortgage rates topped 8% for the first time since 2000; and the 10-Year Treasury yield is giving investors and business owners the jitters.
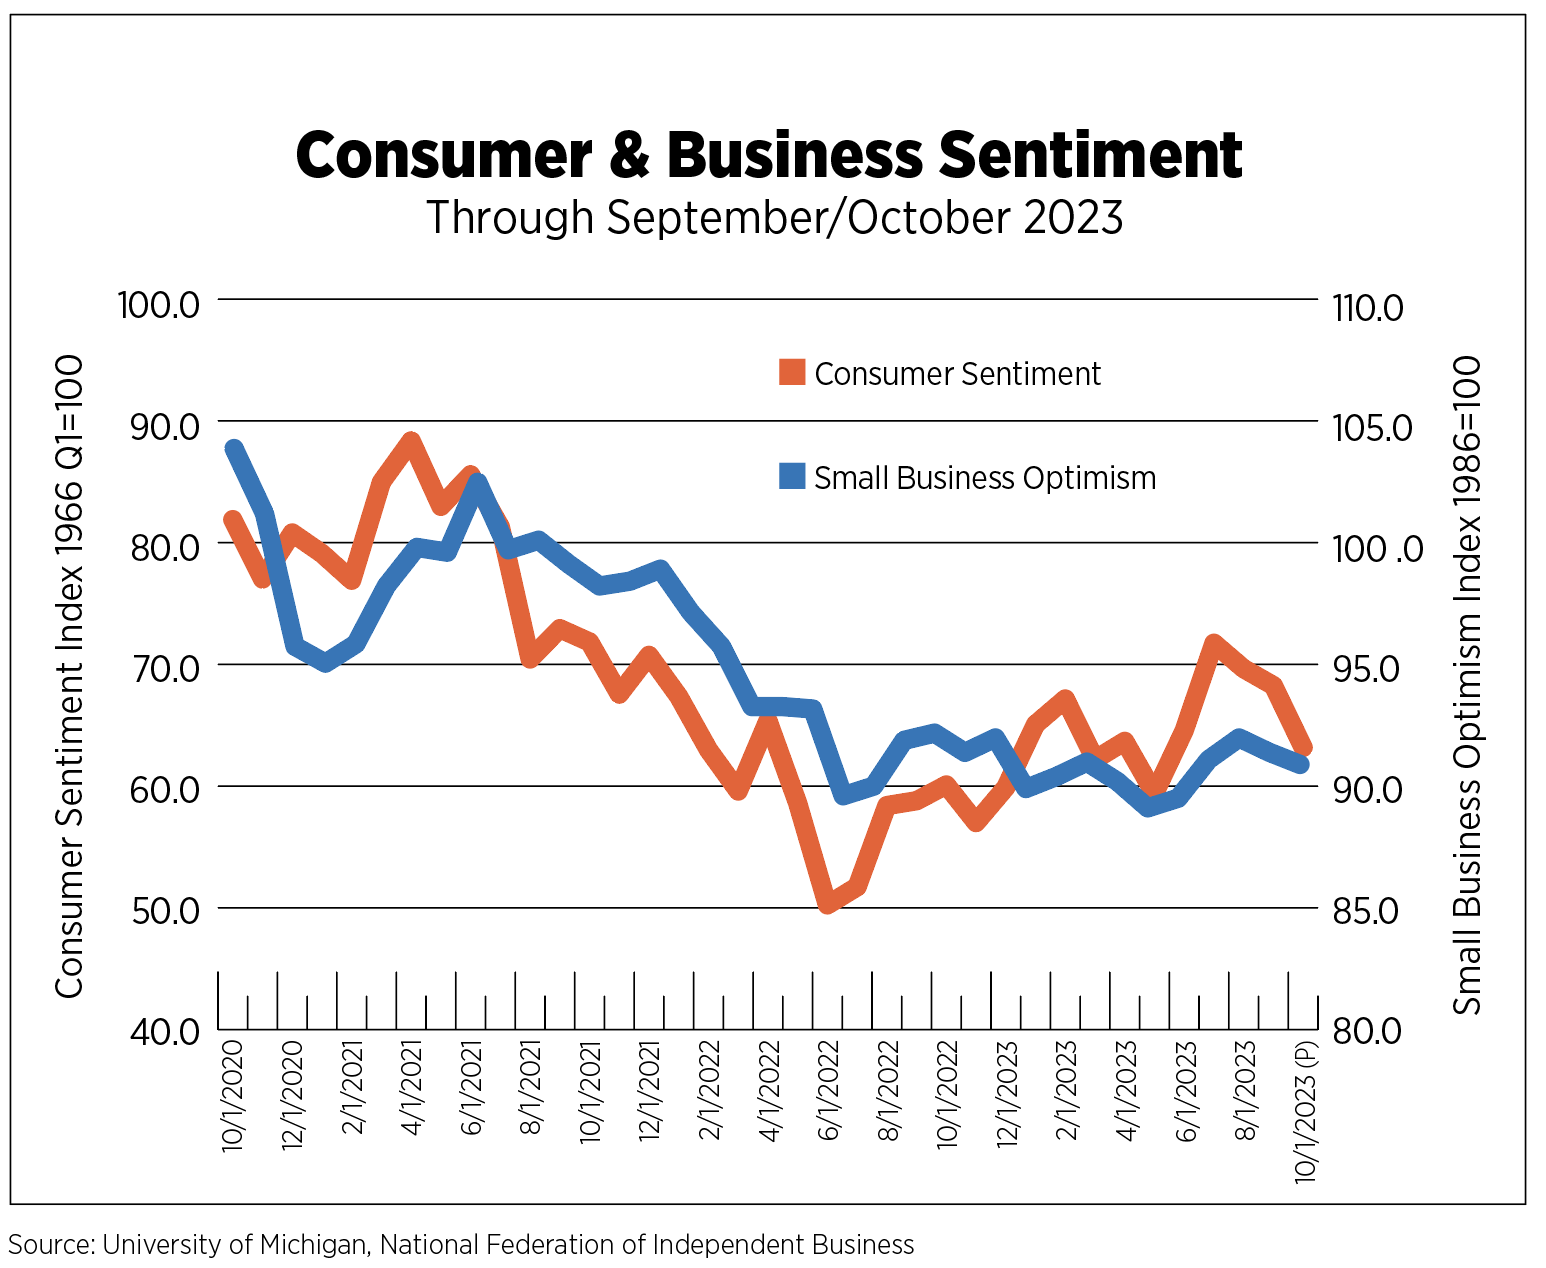
Consumer sentiment, as measured by the University of Michigan Index, had been generally trending up after its series low of 50 in June 2022, but has now declined for three consecutive months, including a steep drop of nearly five points in the preliminary October estimate. Consumer sentiment is highly correlated with gas prices, which rose an astounding 10.6% in August alone. Results from the October survey were also impacted by higher-income consumers due to the recent backsliding in the stock market. Inflation expectations have also begun to creep up again, with consumers expecting an inflation rate of 3.8% one year from now. Five-year expectations remain anchored at about 3%, slightly higher than pre-pandemic ranges.
The National Federation of Independent Business’s Small Business Optimism Index has been below its long-term reading of 98 for 21 straight months. Business owners continued to cite inflation as their number one hurdle, followed by labor quality. Increased wages due to the historically tight labor market have added to cost pressures while high interest rates are making it challenging to invest in other areas of their businesses. The outlook for better conditions over the next six months slipped 13 points in two months but is on par with last year’s level.
The labor market continued to impress with 336,000 jobs added in September, bringing the quarterly total to just under 800,000 new jobs, down from last year but a very strong performance, nonetheless. Initial claims for unemployment remained at healthy levels consistent with a growing economy. Slight cooling of the labor market can be seen in job openings and quits rates, which have both come off highs, but are still well above levels seen before the pandemic. Nearly 2.5 million fewer jobs were available as of August since the peak level in March 2022. Quit levels have also come down, from 4.5 million in early 2022 to 3.6 million in August. Fewer employees quitting means they are more unsure about their prospects for quickly landing another position. Layoff announcements were also higher than long-term norms with nearly 605,000 year-to-date compared to an average of 522,000. Top industries for layoff announcements were technology, retail, healthcare, financial and warehousing, according to the outplacement firm Challenger, Gray & Christmas, with those sectors accounting for 60% of this year’s announced job cuts.
Economic activity also surprised to the upside in Q3 with GDP rising 4.9%, its highest rate in two years. This is a hot rate of growth, and far from the cooling rate the Fed was trying to orchestrate with interest rate hikes. Despite their pessimism and elevated inflation rates, consumers continued to spend, thanks to healthy wage growth, and were responsible for half of GDP growth. On the flip side and a trend that bears watching, consumers are also drawing down their savings and turning to credit cards for some of their purchases. However, the triennial Survey of Consumer Finances, recently published by the Board of Governors at the Fed revealed “broad-based improvements in U.S. family finances over this period, particularly with respect to net worth,” from 2019-2022.

Outlook
There are far more dark clouds on the horizon than bright spots. The war in Israel may not only be a prolonged conflict but has the propensity to spread deeper into the region and has far-reaching implications for the global economy.
In the U.S., while most of the recent strikes have been resolved, it is likely that further work stoppages will impact economic activity heading into next year. The Fed holding interest rates at its November meeting, while expected, was one positive and it seems to have helped stabilize 10-year Treasury yields.
Higher-for-longer interest rates mean the chances for the near stalemate in the existing home sale market continuing are good. Redfin estimates that 80% of homeowners in the U.S. have a mortgage rate below 5% while one-quarter of them have a rate below 3%.
Although lack of demand for housing inhibits economic growth, it should help keep the rental market active. Never before has the monthly payment gap between owning and renting been this high, according to several different sources. Marcus & Millichap estimates that an average monthly homeowner payment (including taxes, home and mortgage insurance) in the U.S. is nearly $1,300 higher than the average monthly rent payment. This relative affordability coupled with consistent job and wage growth will keep market fundamentals solid. But elevated operating expenses, capital and financing costs will keep industry growth subdued as we head into 2024.