Economic Indicators
The Labor Market
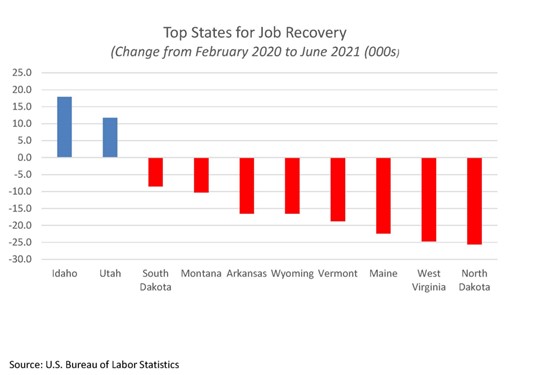
The June jobs report was strong, with 850,000 jobs added plus an upward revision of 15,000 jobs in April and May combined.
The labor market still has 6.8 million jobs to recover or add to return to pre-pandemic levels.
Only two states have exceeded their payroll levels of February 2020: Idaho and Utah. At the opposite extreme, California remained down 1.2 million jobs and New York is down 951,000 jobs.
Unemployment Claims
After hitting its lowest level since the pandemic began, initial claims for unemployment posted a surprising increase for the week ending July 17.
Expanded benefits will expire at the end of September, but 26 states have already stopped additional payments.
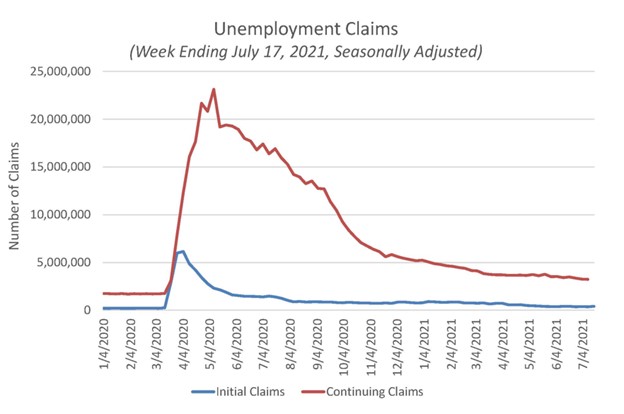
Source: U.S. Employment and Training Administration, Initial Claims [ICSA], retrieved from FRED, Federal Reserve Bank of St. Louis; July 27, 2021
Consumer Sentiment
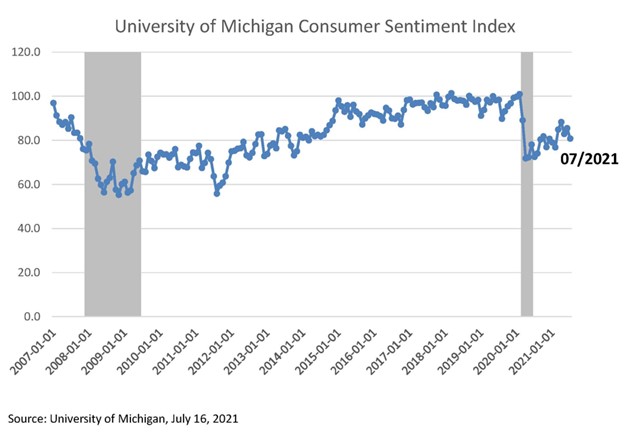
July consumer sentiment fell by nearly 5 points to 80.8, with the expectations index experiencing a steeper drop than the current conditions component.
The decline was mainly due to inflation expectations with the percentage of consumers citing elevated prices for vehicles, homes and durable goods at a record high.
Personal Saving Rate
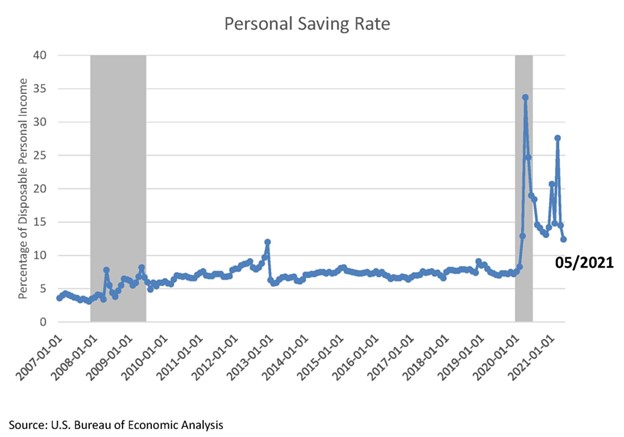
The personal saving rate dropped to its lowest level since the pandemic began but remains elevated at 12.4%.
As fiscal stimulus impacts wane and consumers start making purchases put off last year –at higher prices –the saving rate can be expected to erode further in the coming months.
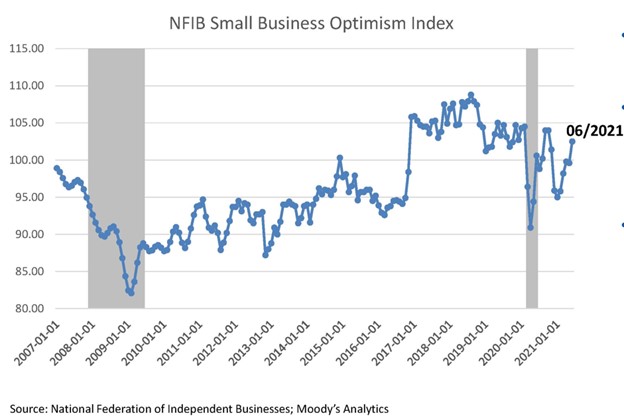
Small Business Optimism
The Small Business Optimism Index rose to its highest level since November.
The largest increase occurred in the component measuring future business conditions, although it remains in negative territory.
46% of business owners had job openings that could not be filled, a slight drop from the prior month’s all-time high but more than double the 48-year historical average of 22 percent.
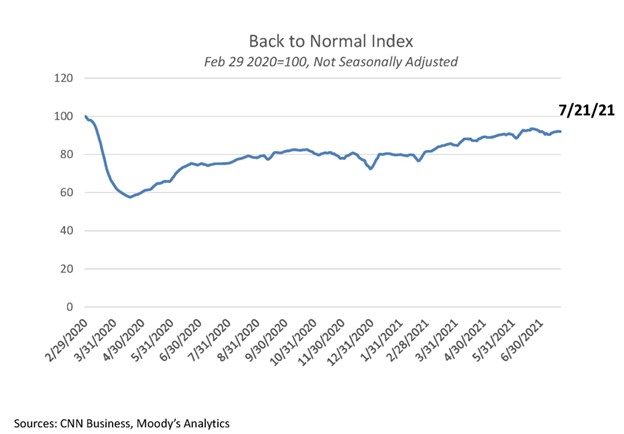
The Back to Normal Index
The Back to Normal Index tracks twelve high frequency data series plus monthly employment figures, using February 29, 2020as the baseline for “normal.”
The index has been moving sideways this month with a reading of 92 during the third week of July.
The fifteen largest states ranged from 81.2 in New York to 98.1 n Florida, which had previously surpassed (>100) pre-pandemic activity.
Home Price Index
The S&P/CoreLogic Case-Shiller 20-City Composite Home Price Index set its second consecutive record in May, increasing 17% year-over-year.
Home prices in Phoenix soared nearly 26% while the remaining cities all experienced double-digit growth.
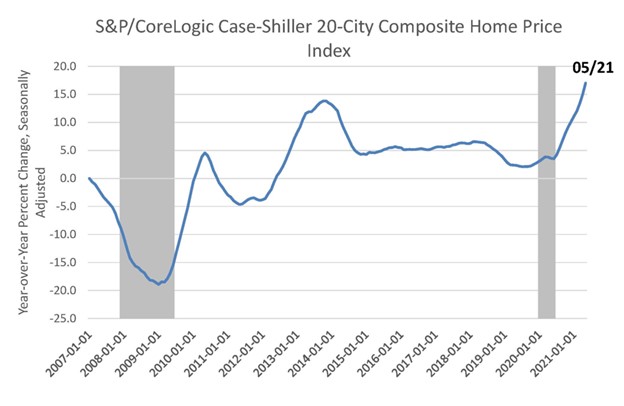
Source: S&P Dow Jones Indices LLC, S&P/Case-Shiller 20-City Composite Home Price Index, retrieved from FRED, Federal Reserve Bank of St. Louis; July 27, 2021
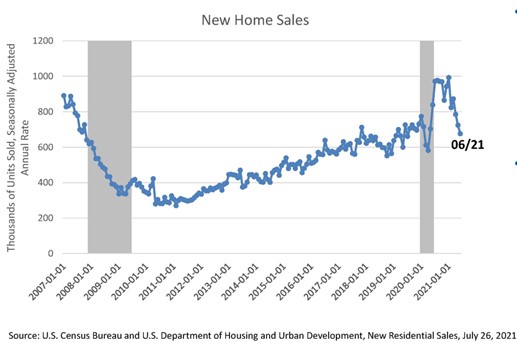
New Home Sales
New home sales declined for the third consecutive month with prior months’ figures revised downward by 90,000 units. This is the lowest level of sales since the height of the pandemic shutdowns in April 2020.
Supply chain, labor constraints and an ever-growing pipeline are weighing on the home-building market while surging home prices and waning fiscal stimulus impacts are moderating demand.
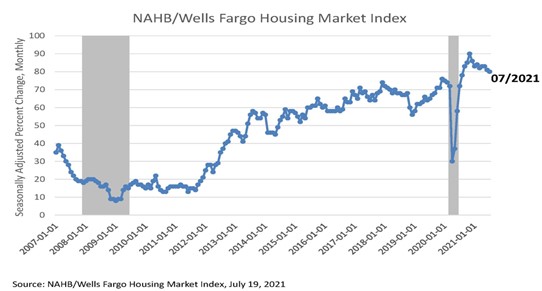
New Home Building
Overall homebuilder confidence fell slightly in July, but the component measuring buyer traffic fell by six points.
However, any reading over 50 means more builders view conditions as good rather than poor. The overall index remained elevated at 80.
Despite materials costs and labor market issues, builders remain optimistic as the future sales component rose two points.
Housing Permits
Single-family and multifamily permitting activity has declined for four and three consecutive months, respectively.
Myriad issues continued to plague the construction industry, yet activity remained elevated for single-family permits and in line with 2019 levels for multifamily.
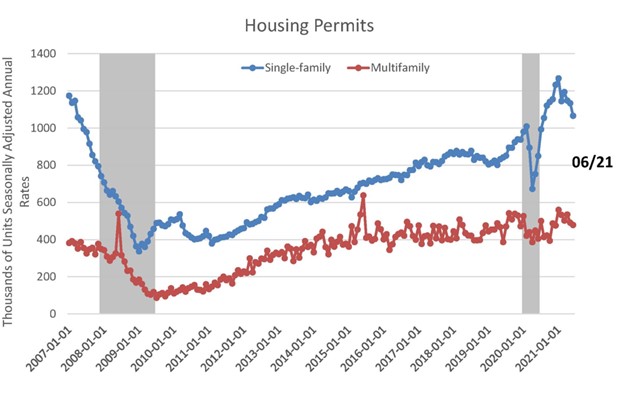
Source: U.S. Census Bureau and U.S. Department of Housing and Urban Development, New Residential Construction, July 20, 2021
Housing Starts
Housing starts were higher than expected in June.
Multifamily starts increased 6.8% over the month but the prior two months were revised downward by 29,000 units.
Activity was strong in the West and South but contracted in the Northeast and Midwest.
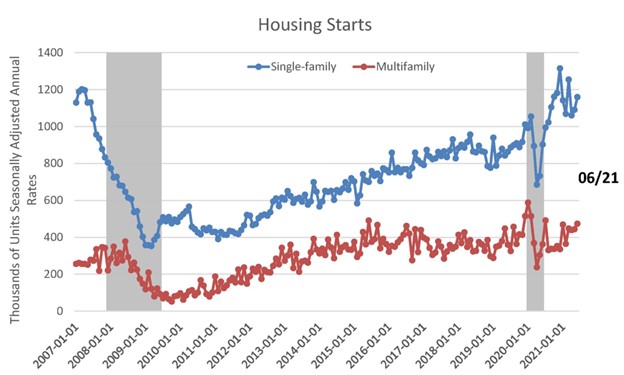
Source: U.S. Census Bureau and U.S. Department of Housing and Urban Development, New Residential Construction, July 20, 2021
Apartment Industry Indicators
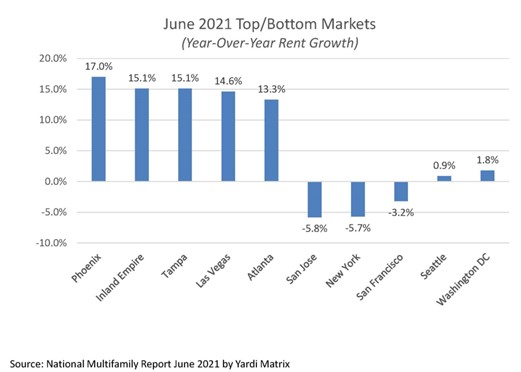
Apartment Rental Rates
Multifamily asking rents increased substantially by 6.3% on a year-over-year basis in June. This was the largest increase in the history of Yardi’s data set.
Renter migration is pushing up rents in the Southwest and Southeast markets.
People are returning to urban cores markets. New York, Seattle, Chicago and Washington, D.C. have begun to rebound.
Multifamily Investor Intentions
- Multifamily/residential was the second most preferred property sector for 2021 investment in the Americas and EMEA.
- Preference for the sector remained the same as 2020 at 25% of survey respondents.
- Student and senior housing remain popular among alternative real estate sectors, but not as much as in 2020.
- Single-family rental housing and co-living both registered strong interest.
- Austin and Phoenix were the top-ranked markets in the United States.
- In contrast to other sectors, most multifamily/residential investors do not expect any pricing discounts.
- Key strategies for 2021 include a greater emphasis on tenant credit and rent roll growth, along with a stronger focus on long-term growth.
- Environmental, Social and Corporate Governance criteria ranked the third key priority by respondents.
Source: Global Investor Intentions Survey 2021-Multifamily/Residential June 2021 by CBRE Research
Capital Market Trends
- Apartment deal activity in Q2 2021 shot up by 238% year-over-year and 40% ahead of pre-pandemic averages. It also stood at a record-high level for any second quarter period.
- Year-over-year price change increased by 12%.
- Total transaction volume reached $52.7 billion; individual asset sales made up $43.3 billion in sales.
- There is slightly less momentum behind the rise in the sale of mid/high-rise assets. In contrast, garden apartments sales saw higher increases.
- The RCA CPPI for garden apartments climbed 12.7% year-over-year in Q2 as opposed to only a 4.7% pace for mid/high-rise assets.
- Dallas, Atlanta, Phoenix, Los Angeles and Denver were the most active markets for apartment investments during the second quarter.
Source: Capital Trends US Apartment Q2 2021 by Real Capital Analytics July 2021
View previous Economic & Industry Updates here.