
Coming off a year in which the apartment industry arguably turned in its best performance on record, owners and operators are facing more challenges in 2022. Persistent inflation, higher interest rates and a stubbornly tight labor market translate into elevated operating costs, while sagging consumer confidence amid a potential recession means revenues may also be at risk heading into 2023.
The data in this report is supported by the strength of the industry’s performance in 2021. The National Apartment Association’s (NAA) new Income/Expense IQ, in partnership with Institute of Real Estate Management (IREM), covers 2021 financials. Because of the new partnership, data from prior NAA Income & Expenses Surveys are not comparable; however, I/E IQ data from 2020 and 2021 in this analysis have been normalized and expressed as a percent of Gross Potential Rent (GPR), except where otherwise specified. It is also important to note that due to the partnership, the sample size for the 2021 survey was significantly larger.
Download Executive Summary PDF
National Results
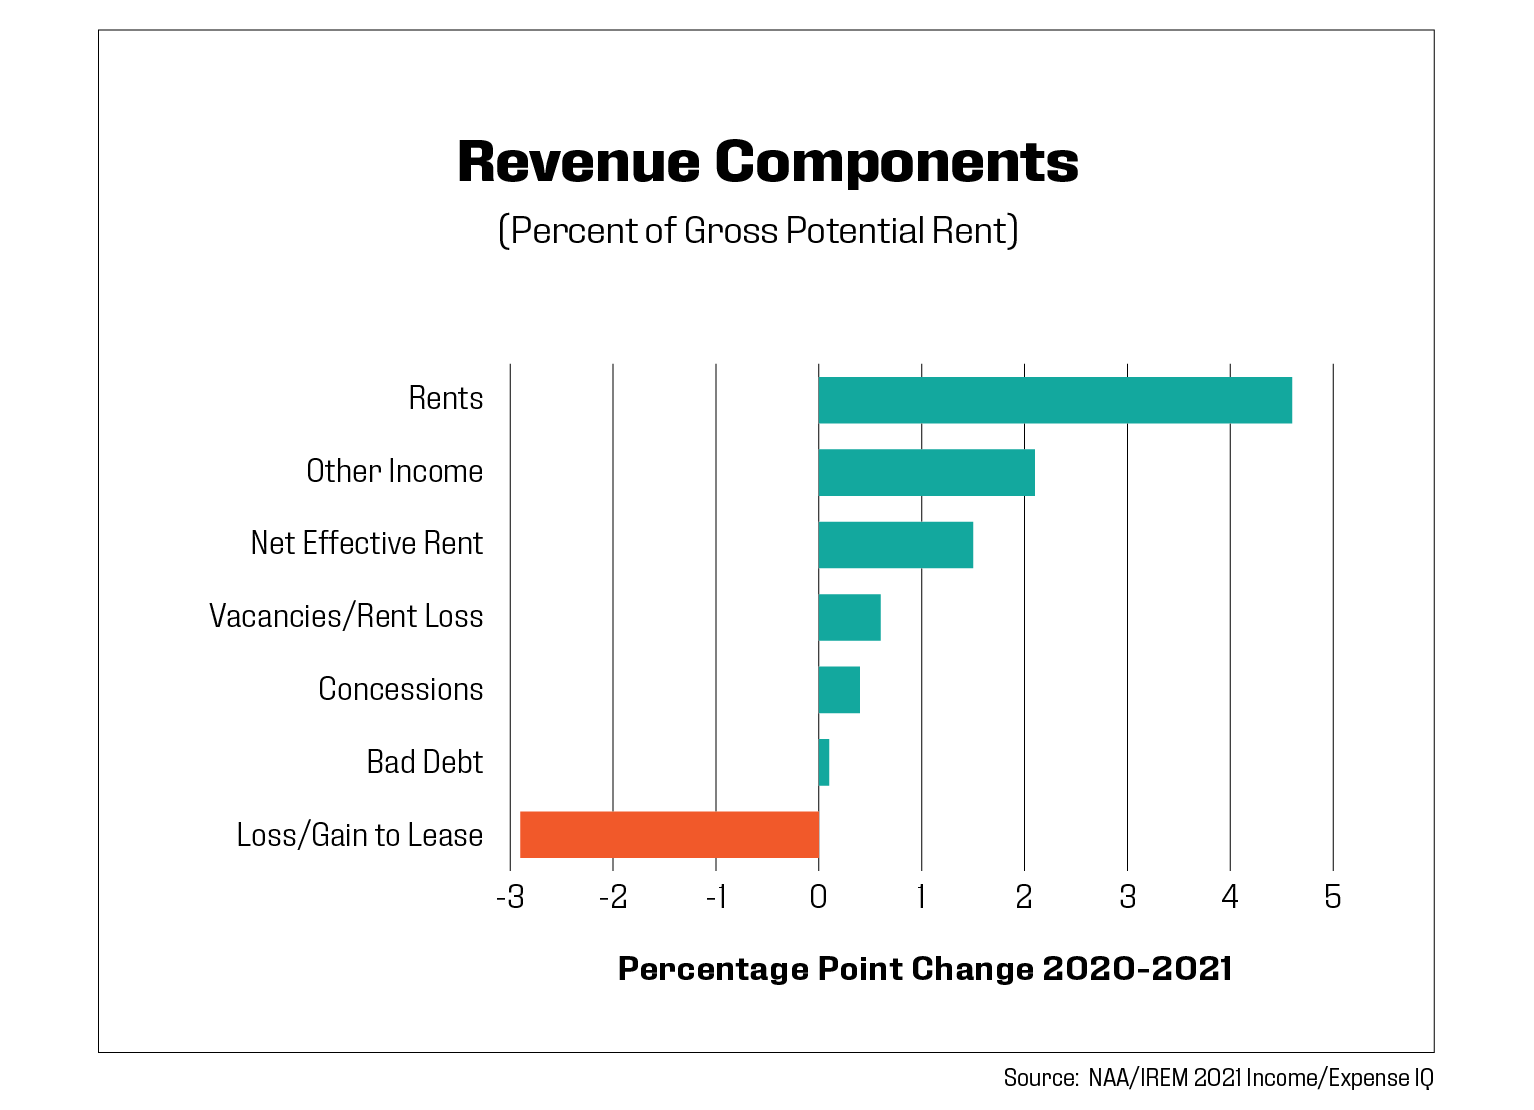
With multiple industry records broken in 2021 for demand and occupancy rates, it is not surprising that average rents increased 4.6 percentage points (ppt). Other income, such as amenities and pet fees, also experienced healthy gains, increasing 2.1 ppt while parking fees, which are included in gross rents, decreased slightly. With market rents experiencing significant growth throughout 2021 amid strong demand and lack of supply, loss-to-lease increased 2.9 percentage points. Losses to vacancy, concessions and bad debt all declined due to stellar market conditions and economic growth, including notable income gains.
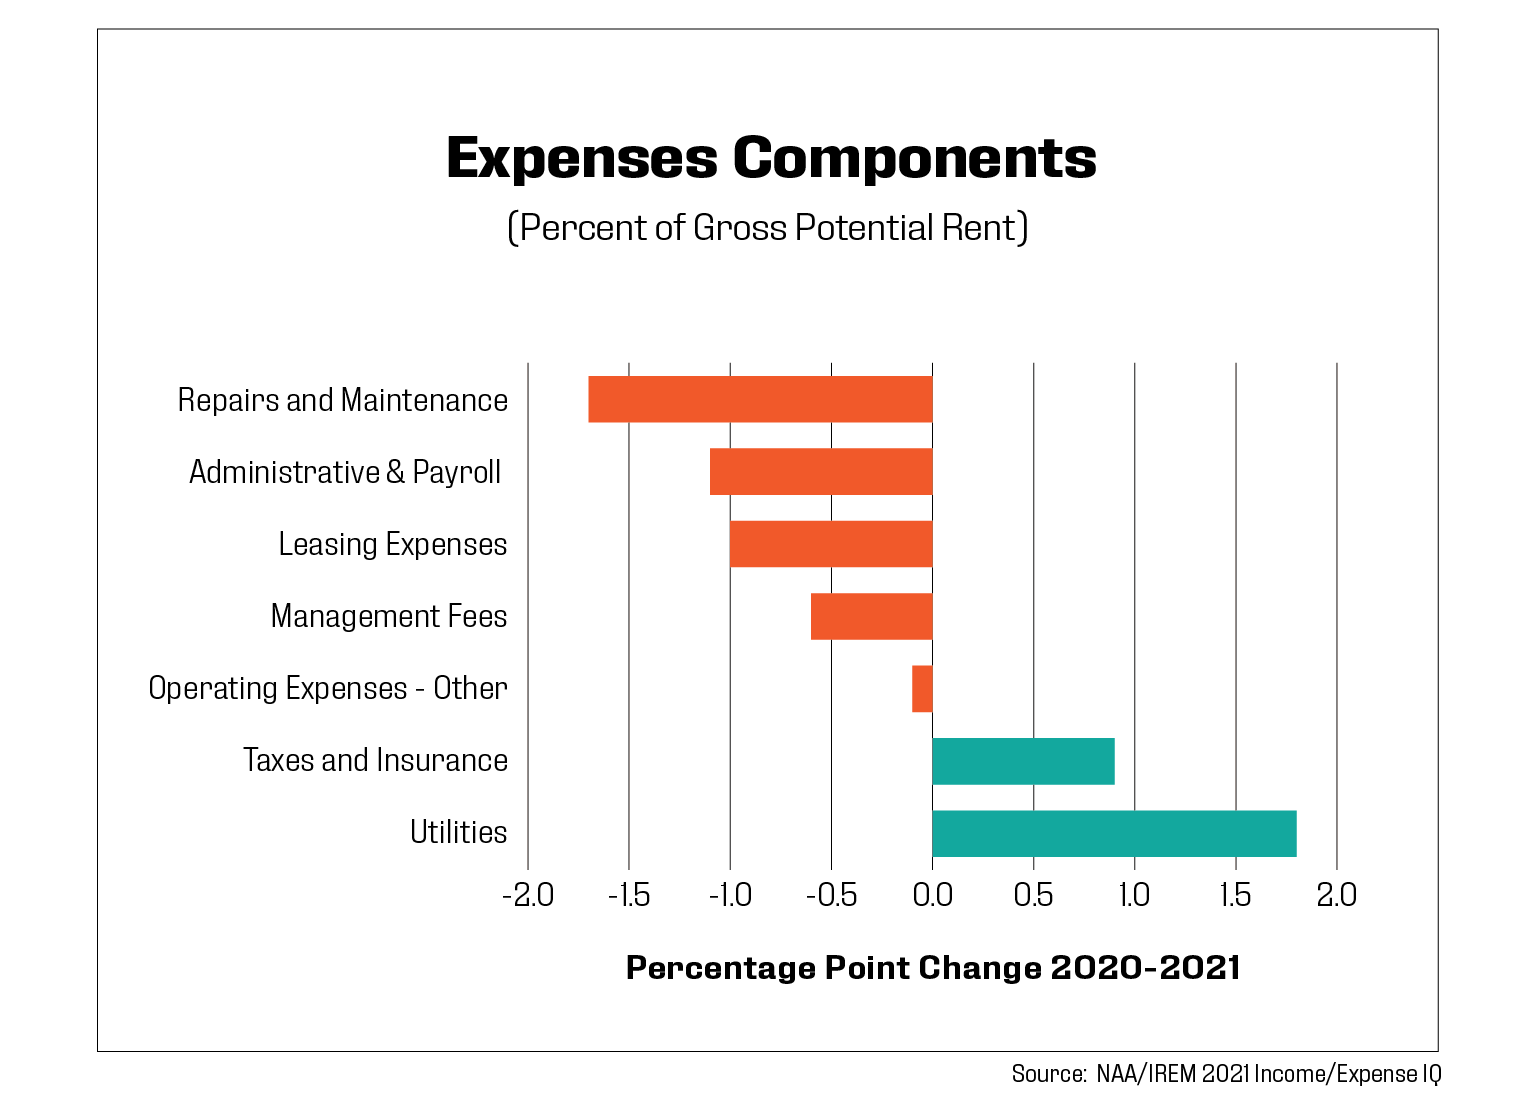
Additionally, renewal rates as reported by RealPage reached a record level in Q3 2021 as residents sought to lock in more favorable rates. Operating expenses declined by 1.8 ppt, which may come as a surprise given the run-up in inflation, which began in earnest in June 2021. But for much of 2021, service price increases were running very near pre-pandemic levels while prices for goods were skyrocketing. Breaking down the repairs and maintenance category, which experienced the largest drop of 1.7 ppt, reveals price increases for appliances, paint and cleaning supplies, while price for janitorial services, elevator repair and maintenance, snow removal and other expenses fell. Other expenses driving the decline in total operating expenses were turnover costs, down 1.2 ppt due to high renewal rates, as previously mentioned.
Payroll expenses declined as expressed as a percentage of GPR. Although wage growth was strong across the U.S., there are several factors at play that may have led total payroll expenses to drop: 1. The perfect storm of record numbers of job openings, high turnover rates and difficulty filling positions, ultimately leaving vacant positions open longer; 2. The retirement of experienced, top-salaried employees; and 3. The pace of technology adoption, which accelerated during the pandemic and continues today. In fact, one large multifamily housing firm reported that just one of its technology initiatives resulted in 7,500 fewer labor hours per month and a 15% reduction in onsite staff.
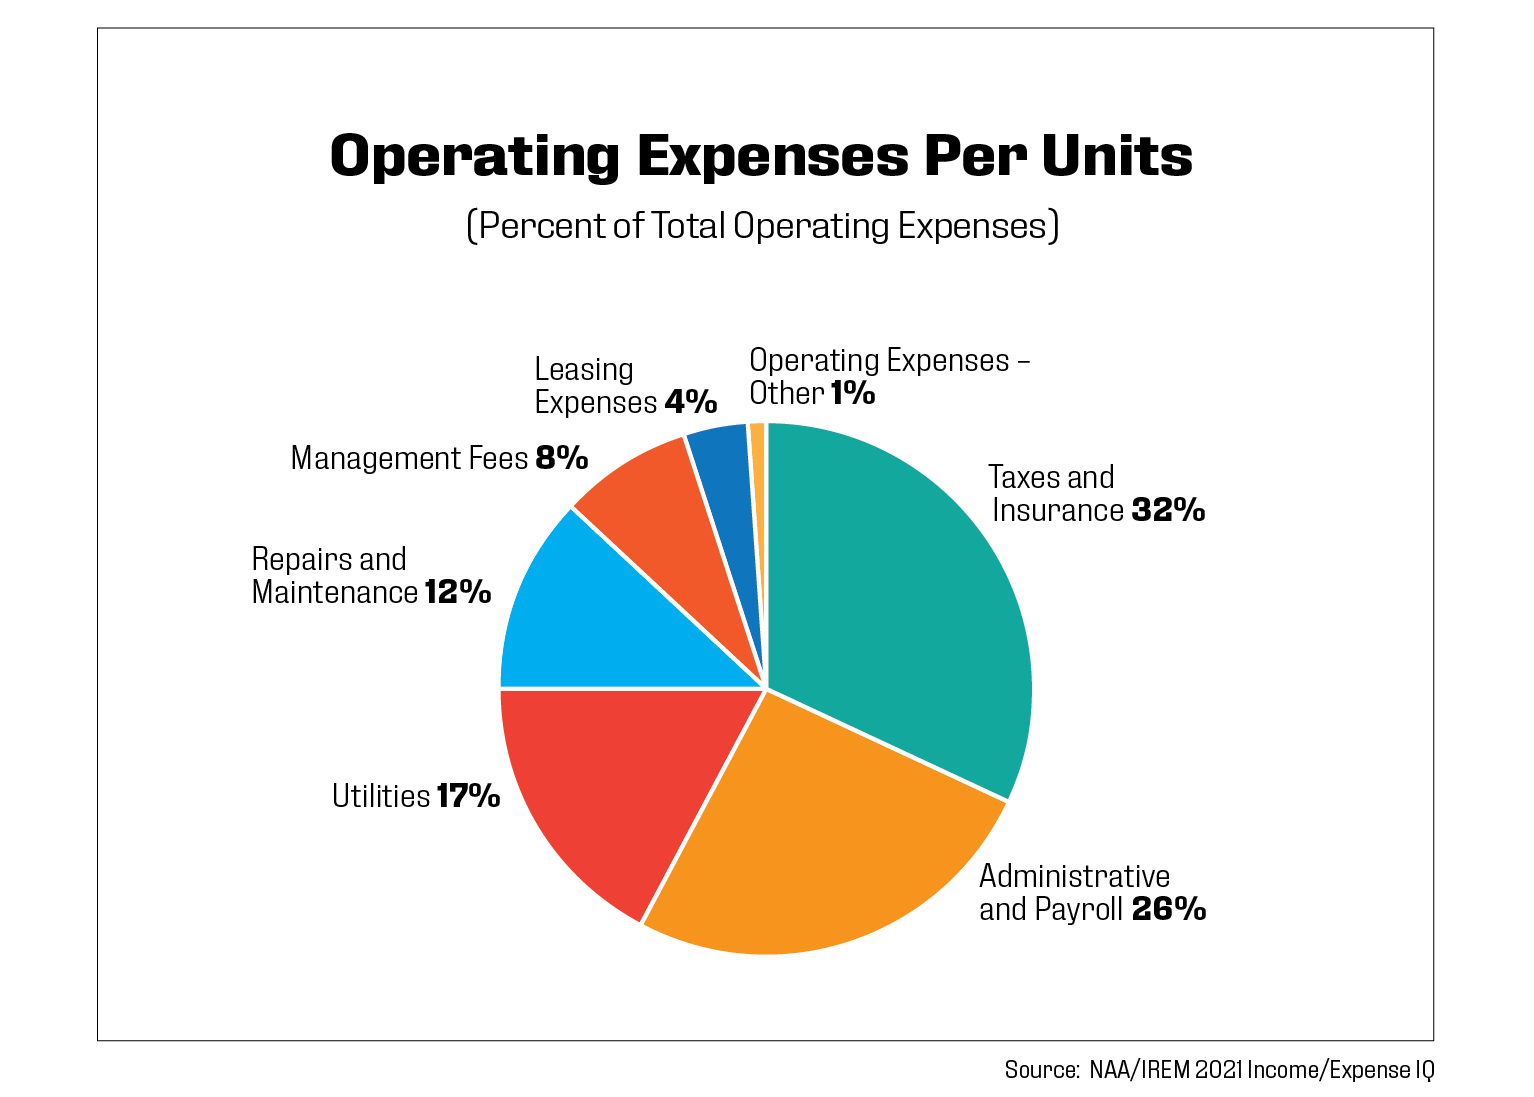
Utility costs experienced the most significant increase, rising 1.8 ppt, and almost entirely driven by heating fuel, up 1.4 ppt. With the exception of gasoline, fuel oils and other fuels experienced the largest annual increases in prices in the energy category of the Consumer Price Index: 27.6%, according to the Bureau of Labor Statistics.
Property taxes and insurance were also on the rise in 2021, increasing a total of 0.9 ppt. According to a survey conducted in 2021 by NDP Analytics and sponsored by NAA along with five other housing organizations, 60% of survey respondents reported general umbrella/excess liability insurance cost increases greater than 15%, while one-in-10 saw their premiums double or more than double. With climate change driving more frequent natural disasters, there will likely be no relief from mounting insurance costs.
Finally, net operating income (NOI) posted an impressive 5.4 ppt increase with 2021 going down in the record books across all apartment indicators. Markets in the Sun Belt performed particularly well due to heavy in-migration, strong household formations and solid job growth.
Metropolitan Area Overview
The 2021 Income/Expense IQ provides conventional apartment benchmark data for more than 80 metropolitan areas. This metro area analysis focuses on year-over-year trends for operating expenses, total and net operating income for metro areas with 20 or more properties in the sample.
The combination of renter wage growth, low vacancy rates and an increasingly tight supply of for-sale homes caused rent prices to skyrocket in the year 2021. Sun Belt markets witnessed the highest rent growth as they welcomed strong renter in-migration from high-cost coastal states like California and New York.
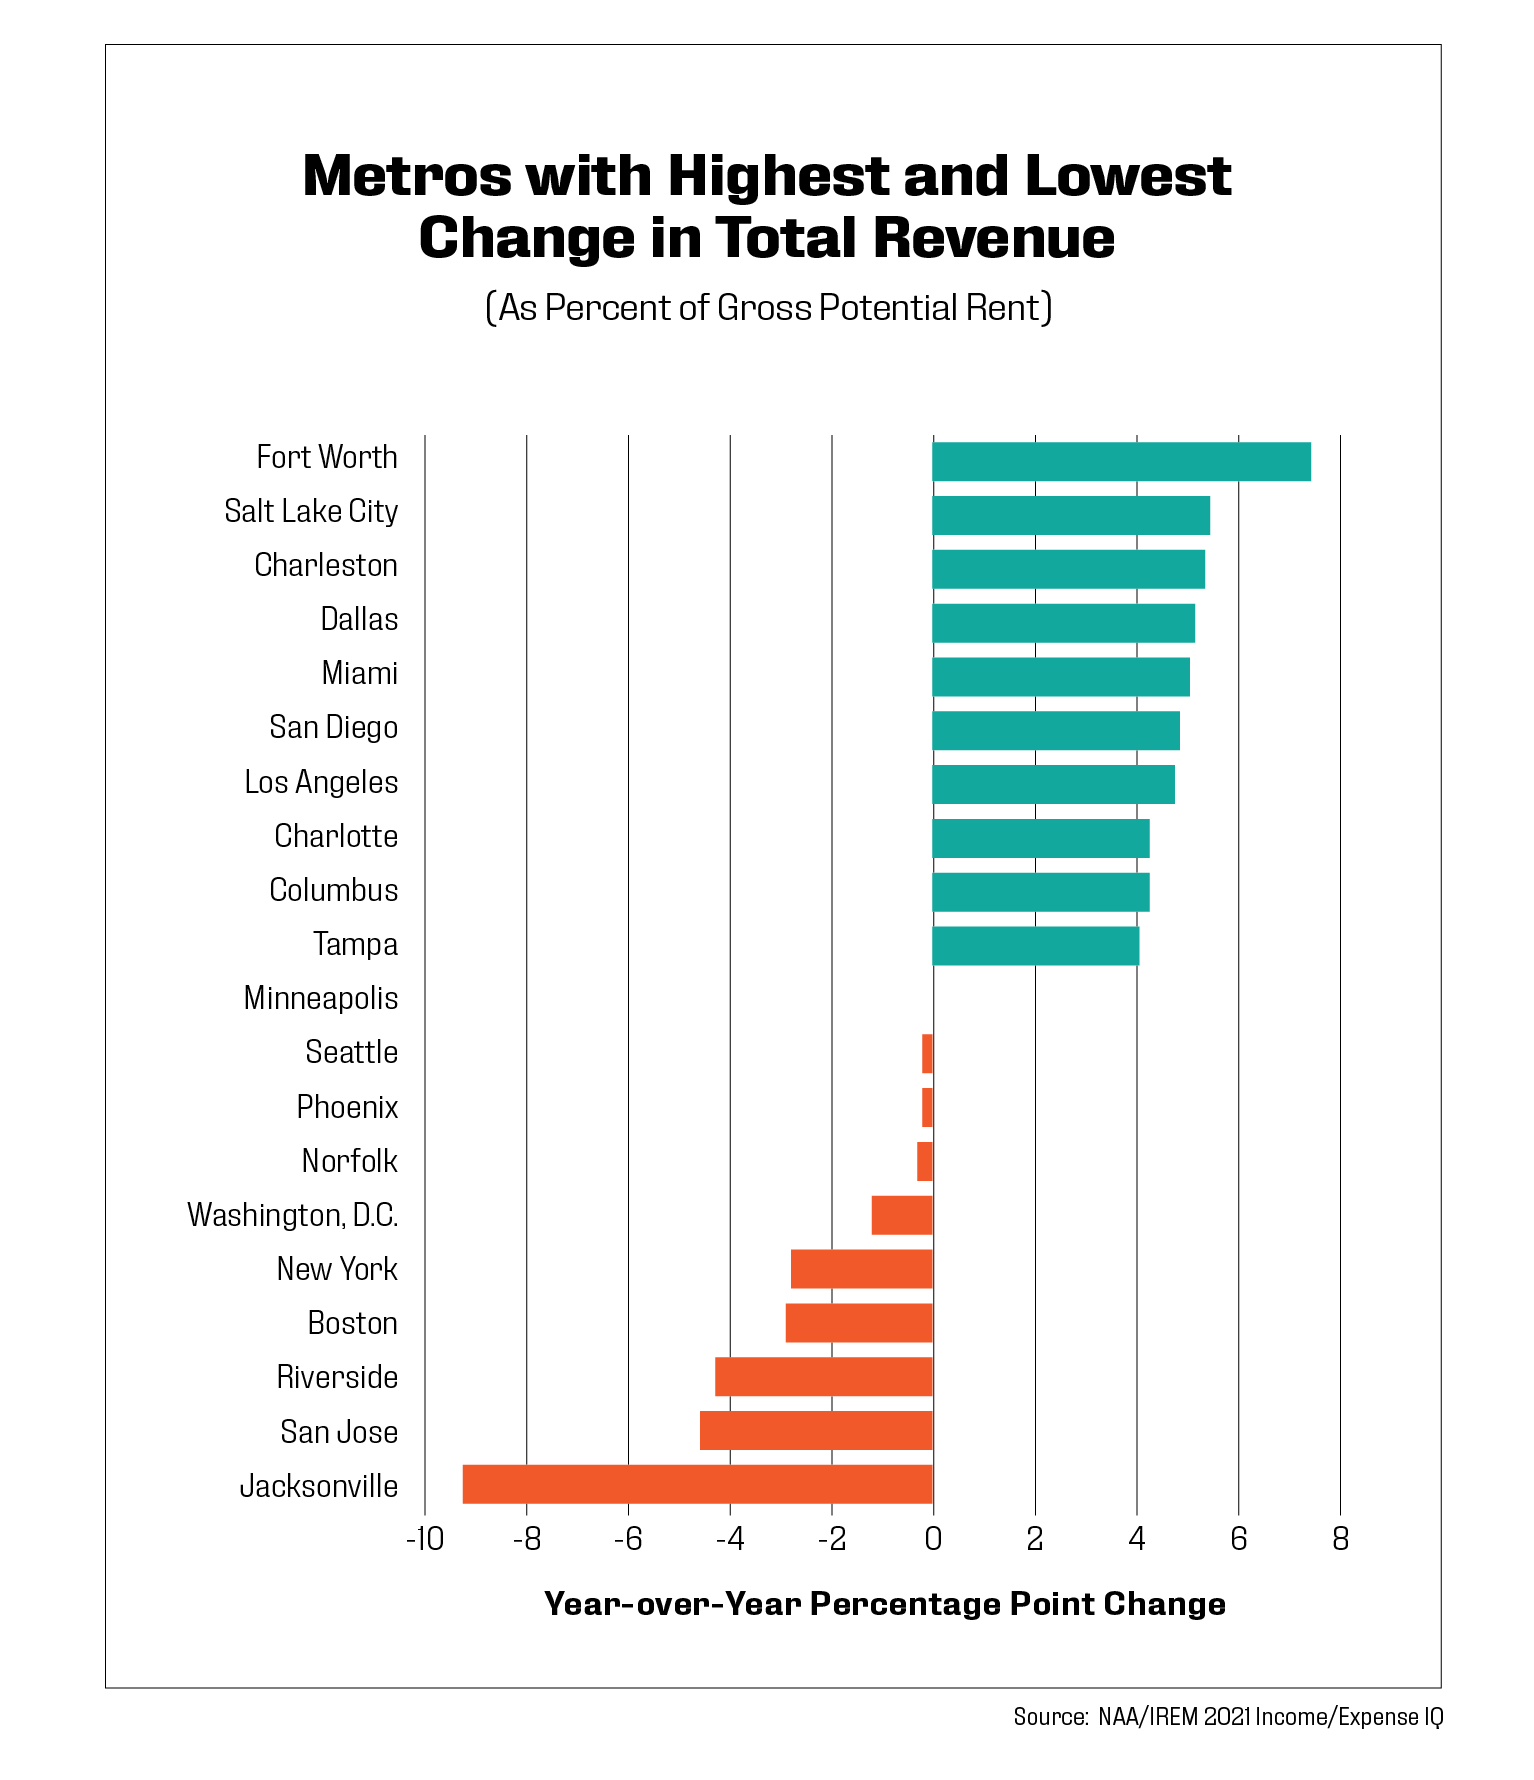
As a result of elevated rent growth, 30 out of the 39 markets analyzed for this report recorded a year-over-year increase in total revenue. The leading markets for revenue growth included Fort Worth, Texas; Salt Lake City; Charleston, S.C.; Dallas; and Miami. In contrast, Jacksonville, Fla., and San Jose and Riverside, Calif., ranked lowest for revenue growth, attributable to residents not paying their rent. According to CoStar Group, asking rents in Jacksonville increased by more than 20% in 2021, one of the largest increases in the U.S. Although asking rents improved substantially, loss-to-lease was greater than what was seen in 2020. This means the actual rent being charged for a resident to lease an apartment is lower than the asking rent.
Net operating income per unit varied from $24,420 in New York City to $3,866 in Kansas City, Mo. Tampa and Fort Lauderdale, Fla., had the highest growth in NOI, experiencing a 34.4 and 32.2 percentage point increase, respectively. In contrast, NOI in San Jose and New York declined 21.2 and 12.3 percentage points. Robust demand was the catalyst for income growth in Florida markets. Rental rates rapidly increased during the pandemic as renters flocked to the Sunshine State because of low taxes, job opportunities and affordable cost of living. Meanwhile, the total income per unit in San Jose fell year-over-year, which reflects how the remote work revolution has impacted this technology hub.
Operating expenses ranged from $3,005 per unit in Wichita, Kan., to $17,066 in New York City. Jacksonville was also the leading market for reduced operating expenses, declining by 30.3 percentage points. Reductions in natural gas, management fees and administrative expenses were the key contributors to improved operating expenses in Jacksonville.

San Jose was the top-ranking market for increased operating expenses, up 16.6 percentage points due to increases in payroll, administration, insurance and water and sewer expenses.
Outlook
Uncertainty abounds for the U.S. economy heading into Q4 2022 as it appears less and less likely that the Federal Reserve will execute a soft landing and avoid a recession. The labor market remains stubbornly healthy despite the Fed’s attempts to cool it. Although consumer sentiment recently ticked up thanks to gas prices falling, both consumer and business confidence remain subdued. All economic forecasts have been sharply downgraded from the beginning of the year, including higher rates of inflation and unemployment, and lower rates of GDP growth. Some analysts believe we are already in a recession; others are increasing the odds of a recession occurring anytime between now and the end of 2023; and still others believe we are in a housing recession. Sales of existing homes have decreased for seven consecutive months, according to the National Association of Realtors, and pricing shows signs of moderating as well. Mortgage rates are at a 12-year-high, putting homeownership out of reach for many potential buyers. Decreased sales traffic, persistent cost pressures and continued kinks in the supply chain have caused the National Association of Home Builders Housing Market Index to decline for 9 months, to 46 in September. A reading below 50 indicates more builders view conditions as poor than good.
For the apartment sector, rising interest rates are already triggering some investors and developers to press the pause button. As expected, rent growth has begun to cool after the substantial increases of 2021, and demand has weakened in some markets.
According to a Trepp 2022 CRE Sentiment Survey released in August, which included not only real estate market professionals but experts in structured finance, banking, capital markets and academia, 58% of respondents say they believe multifamily will have the highest level of transaction activity within the next 6 months; more than 50% expect economic occupancy rates to increase; and more than 70% expect net effective rent to increase. The resiliency of the apartment market can’t be overstated. While it is not recession-proof, clearly evident in 2020, it tends to weather downturns better than other asset types. Still, owners and operators need to prepare for an extended period of inflation, higher interest rates and potential cracks in the labor market—all of which would dampen fundamentals in 2023, with or without a recession.
About the Income/Expense IQ
NAA and IREM have partnered with Lobby CRE to provide comprehensive income and expenses benchmarking data in a simplified digital format. Data for the 2021 Income/Expense IQ were reported to the multifamily benchmarks for 6,476 conventional properties containing 917,006 units. Benchmarks are based on 2021 operating data provided by NAA and IREM members and other real estate practitioners. Currently, there are multifamily benchmarks available for over 80 major U.S. markets. The benchmark data is presented in three forms: Total dollar amount, dollars per unit and dollars per unit as a percentage of income.
Income/Expense IQ features and benefits include:
- In-platform comparisons: Configure your property’s T12s in monthly, quarterly, annual or custom-defined periods and compare them to a benchmark in real-time.
- Filtering: Tailor your filters to ensure the benchmark, and its results, accurately reflect your property’s attributes.
- Collaboration: Get your team on the case by inviting team members to the platform to collaborate, share data insights, and spot areas where you can improve.
- Live benchmarks: Income/Expense IQ technology recalculates benchmarks monthly to ensure newly added property data is captured. This allows you to unlock more granular benchmark configurations as the data pool increases.
- Automated submission: With the new Income/Expense IQ tool, you can securely submit data to gain access to additional platform features. And submitting data doesn’t require manual spreadsheets and emailed data. Schedule reports from property management software (PMS) to upload automatically to the platform.
Visit naahq.org for more information and to access the Income/Expense IQ platform.
2021 National Multifamily Income/Expense IQ Benchmark

Glossary of Terms
Administrative. Total monies spent on general and administrative items such as mileage reimbursement, bank charges, legal/eviction charges, postage, office supplies, uniforms, credit reports, permits, membership dues, subscriptions, data processing, etc. Does not include any payroll-related expenses.
Other Administrative Expenses. Any administrative expenses that cannot be attributed to the included list of administrative expense line items.
Communications. Total monies spent on communication utilities such as telephone, internet and wireless services.
Contract Services/Professional Fees. Payments to vendors for services rendered. Trash services should be included under “other utilities.”
Gross Potential Rent. Total rents of all occupied units at year of submission lease rates and all vacant units at year of submission market rents (or fiscal year end).
Heating/Cooling Fuel. Type of fuel used in apartment units.
Insurance. Includes property hazard and liability and real property insurance and does not include
health/payroll insurance.
Leasing Expenses. Includes marketing/advertising, turnover expenses and other leasing expenses.
Other Leasing Expenses. Any leasing expenses that cannot be attributed to the included list of leasing expense line items.
Loss/Gain to Lease. Difference between actual contract rents and market rental rates.
Management Fees. Total fees paid to the management agent/company by the owner.
Marketing/Advertising. Includes all marketing and advertising expenses for the property.
Net Commercial Square Footage. Total rentable square feet of commercial floor space.
Net Rentable Residential Square Feet. Total rentable square feet of floor space in residential units only. Area reported includes only finished space inside four perimeter walls of each unit. Common areas are excluded.
Payroll Expenses. Gross salaries and wages paid to employees assigned to the property in all departments. Includes payroll taxes, group health/life/ disability insurance, 401(k), bonuses, leasing commissions, value of employee apartment allowance, workers’ compensation, retirement contributions, overtime and other cash benefits.
Rental Revenue Commercial/Other. Total rent collections for any commercial space after vacancy/administrative, bad debt and discount or concession losses.
Rental Revenue Residential. Total rent collections for residential units.
Other Rent Adjustments. Any rent adjustments that cannot be attributed to vacancy, concessions
or bad debt.
Repairs and Maintenance. Total monies spent on appliances, carpet, cleaning supplies, elevator repair and maintenance, general building exterior maintenance, grounds maintenance, janitorial expenses, landscaping expenses, general maintenance and repairs, paint/decorating, recreational/amenities repairs and maintenance, security, snow removal and other repairs and maintenance. Does not include any payroll related expenses or non-recurring capital expenses. Contract services are reported separately.
Other Revenue/Income. Monies received including amenity fees, parking fees, laundry, pet fees, storage and “other”). All “other” would include the sum of any items not specifically listed above (e.g., vending, deposit forfeitures, furniture, late fees, termination fees, application fees, etc.). NOTE: Interest income or utility reimbursements are not included. (Utility reimbursement/recovery is subtracted from gross utility costs.)
Revenue Losses/Adjustments to Collections/Bad Debt. Amount of residential rents not received due to collection losses.
Revenue Losses/Adjustments to Concessions. Amounts of gross potential residential rents not received due to concessions.
Revenue Losses/Adjustments to Vacancies. Amount of rental income for residential units not collected because of vacancies and other use of units, such as models and offices.
Taxes. Total real estate and personal property taxesonly. Does not include payroll or rendering fees
related to property taxes or income taxes.
Other Taxes, Fees, Permits. Any permit costs, fees or taxes, outside of property tax. Does not include payroll taxes.
Total Operating Expenses. Sum of all operating costs. The sum of all expense categories must balance with this line, using total net utility expenses only. Does not include debt service or any one-time extraordinary costs or capital costs.
Paula Munger is NAA’s AVP, Industry Research & Analysis. Leah Cuffy is Senior Research Analyst for NAA.