Nearly 40% of all US households live in rental units, which play a crucial role in the nation’s residential infrastructure. After decades of relative stability, the rental share declined steadily between 1995 and 2004 as a rapidly expanding secondary mortgage market and aggressive lending produced a surge in homeownership.
Rising delinquencies and higher mortgage rates began to stem this trend in the mid- 2000’s. The Great Financial Crisis brought declining ownership and increasing renter-ship which persisted until mid-2016. Most recently, the rental share has begun to decline again. Government, academics, and industry leaders are paying greater attention to the rental half of the housing market to understand whether a new national renter/owner equilibrium may be emerging.
Industry Sectors Contributing to Expenditures
Four different types of industry expenditure (activity) were identified and separately analyzed in order to fully capture industry impacts. They are:
- Construction of new rental units
- Renovation and repair of existing properties
- Property operations and maintenance activities
- Spending by renting households
All four industry segments posted very strong growth over the 3 years studied, led by resurgent construction activity: the impacts from new apartment construction almost doubled between 2013 and 2016. In aggregate, economic impacts from all 4 segments expanded by 21% and employment impacts by 16%.
Six economic and demographic factors
Important drivers of impact growth across the 4 industry segments:
1. Population growth
2. Employment growth
3. Rental share of the total housing stock (tenure split)
4. Size and growth of the rental stock’s 5+unit segment
5. Renter household income gains
6. Average effective rent growth
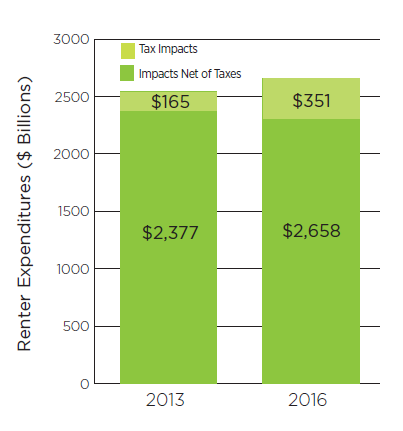
Tax Impact - Renter Spending
In 2016, taxes paid to federal, state and local governments by 5+ unit renter households generated $350 billion in economic activity and 1.87 million jobs.

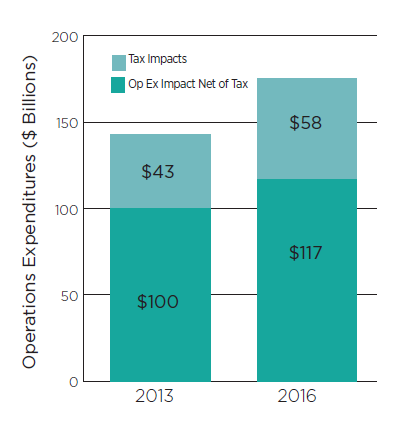
Tax Impact - Operating Expenses
This is the only category that significantly expanded its share of operations expenditures (30 percent to 33 percent) between 2013 and 2016.

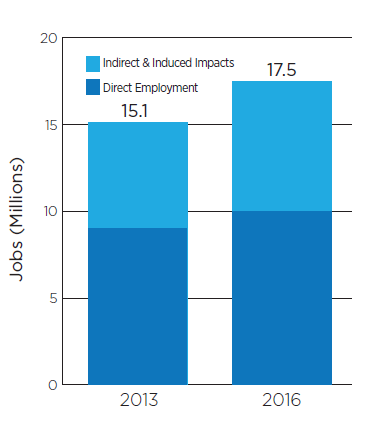
Employment Impact
The U.S. apartment industry generated a total of 17.5 million new jobs in 2016, 12 percent of the total employment gain for that year.

State and Metro Results
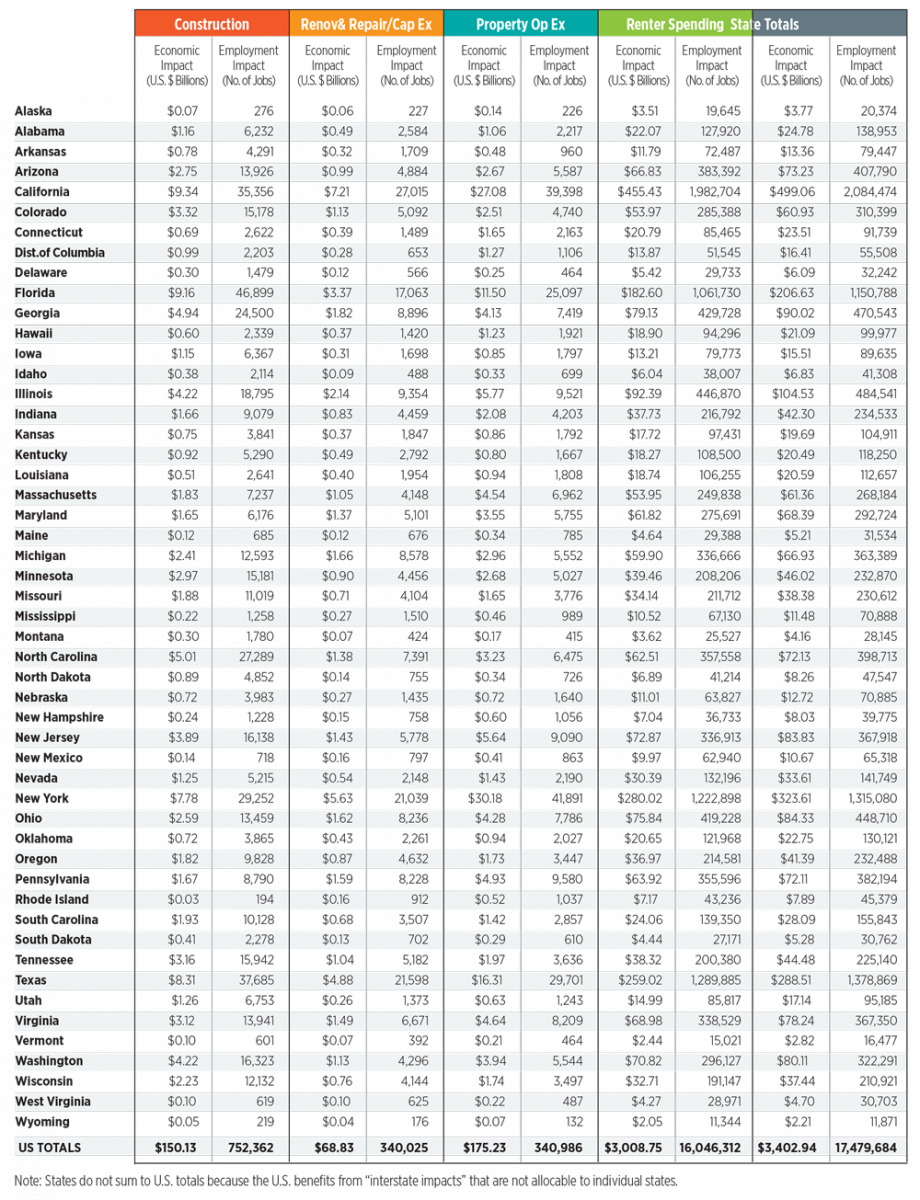
Subsequent rounds of analysis were conducted for the 50 states and the District of Columbia as well as for 50 major metropolitan areas. Results at each geographic level exhibited the same pattern, i.e., significant economic and job impacts with robust growth over the three-year study period. In all, the 50 states+DC (Sum of States, or SOS) generated $2.95 trillion of economic impacts and 14.2 million jobs in 2016. SOS impacts increased by 21 percent ($518 billion in output) and 15 percent (1.86 million jobs) between 2013 and 2016. The performance of individual states and metros was tied to the six impact growth drivers that we identified for the US as a whole. In general, the largest states and metros dominated impacts in absolute terms but – with a few exceptions – posted average or below-average growth relative to their peers. On a percentage growth basis, several mid-sized states and metros that have attracted an outsized share of post-recession population and economic gains top their group rankings.

“The Contribution of Multifamily Housing to the U.S. Economy” is a study which explored the impact the apartment industry had on the US economy in 2013 and 2016. It was conducted by Hoyt Advisory Services on behalf of the National Apartment Association (NAA) and the National Multifamily Housing Council (NMHC). The full report can be found at weareapartments.org.
