
Overview
Insurance, insurance, insurance: it dominated discussions of the apartment industry in 2022 and 2023, but evidenced by data in this report, the financial pain of operating apartments did not stop there. Cooling demand, along with increased competition from new supply and high interest rates, also put a dent in the revenue side, making this time period one of the most challenging for the apartment industry in years.
The 2022 Income/Expense IQ, in partnership with Institute of Real Estate Management (IREM) and Building Owners and Managers Association (BOMA), covers 2022 financials. For the apartment sector, some 4,500 properties representing over 1 million units in 100+ markets are included in the benchmarking data, which was released in August 2023.
This year, NAA is pleased to present a same store analysis in this Executive Summary, enabling direct, absolute comparisons with 2021 data. For this analysis, 31 markets containing more than 20 properties in the sample for a total of 1,603 properties are included. All figures are expressed as per unit per year, unless otherwise noted.
National Results
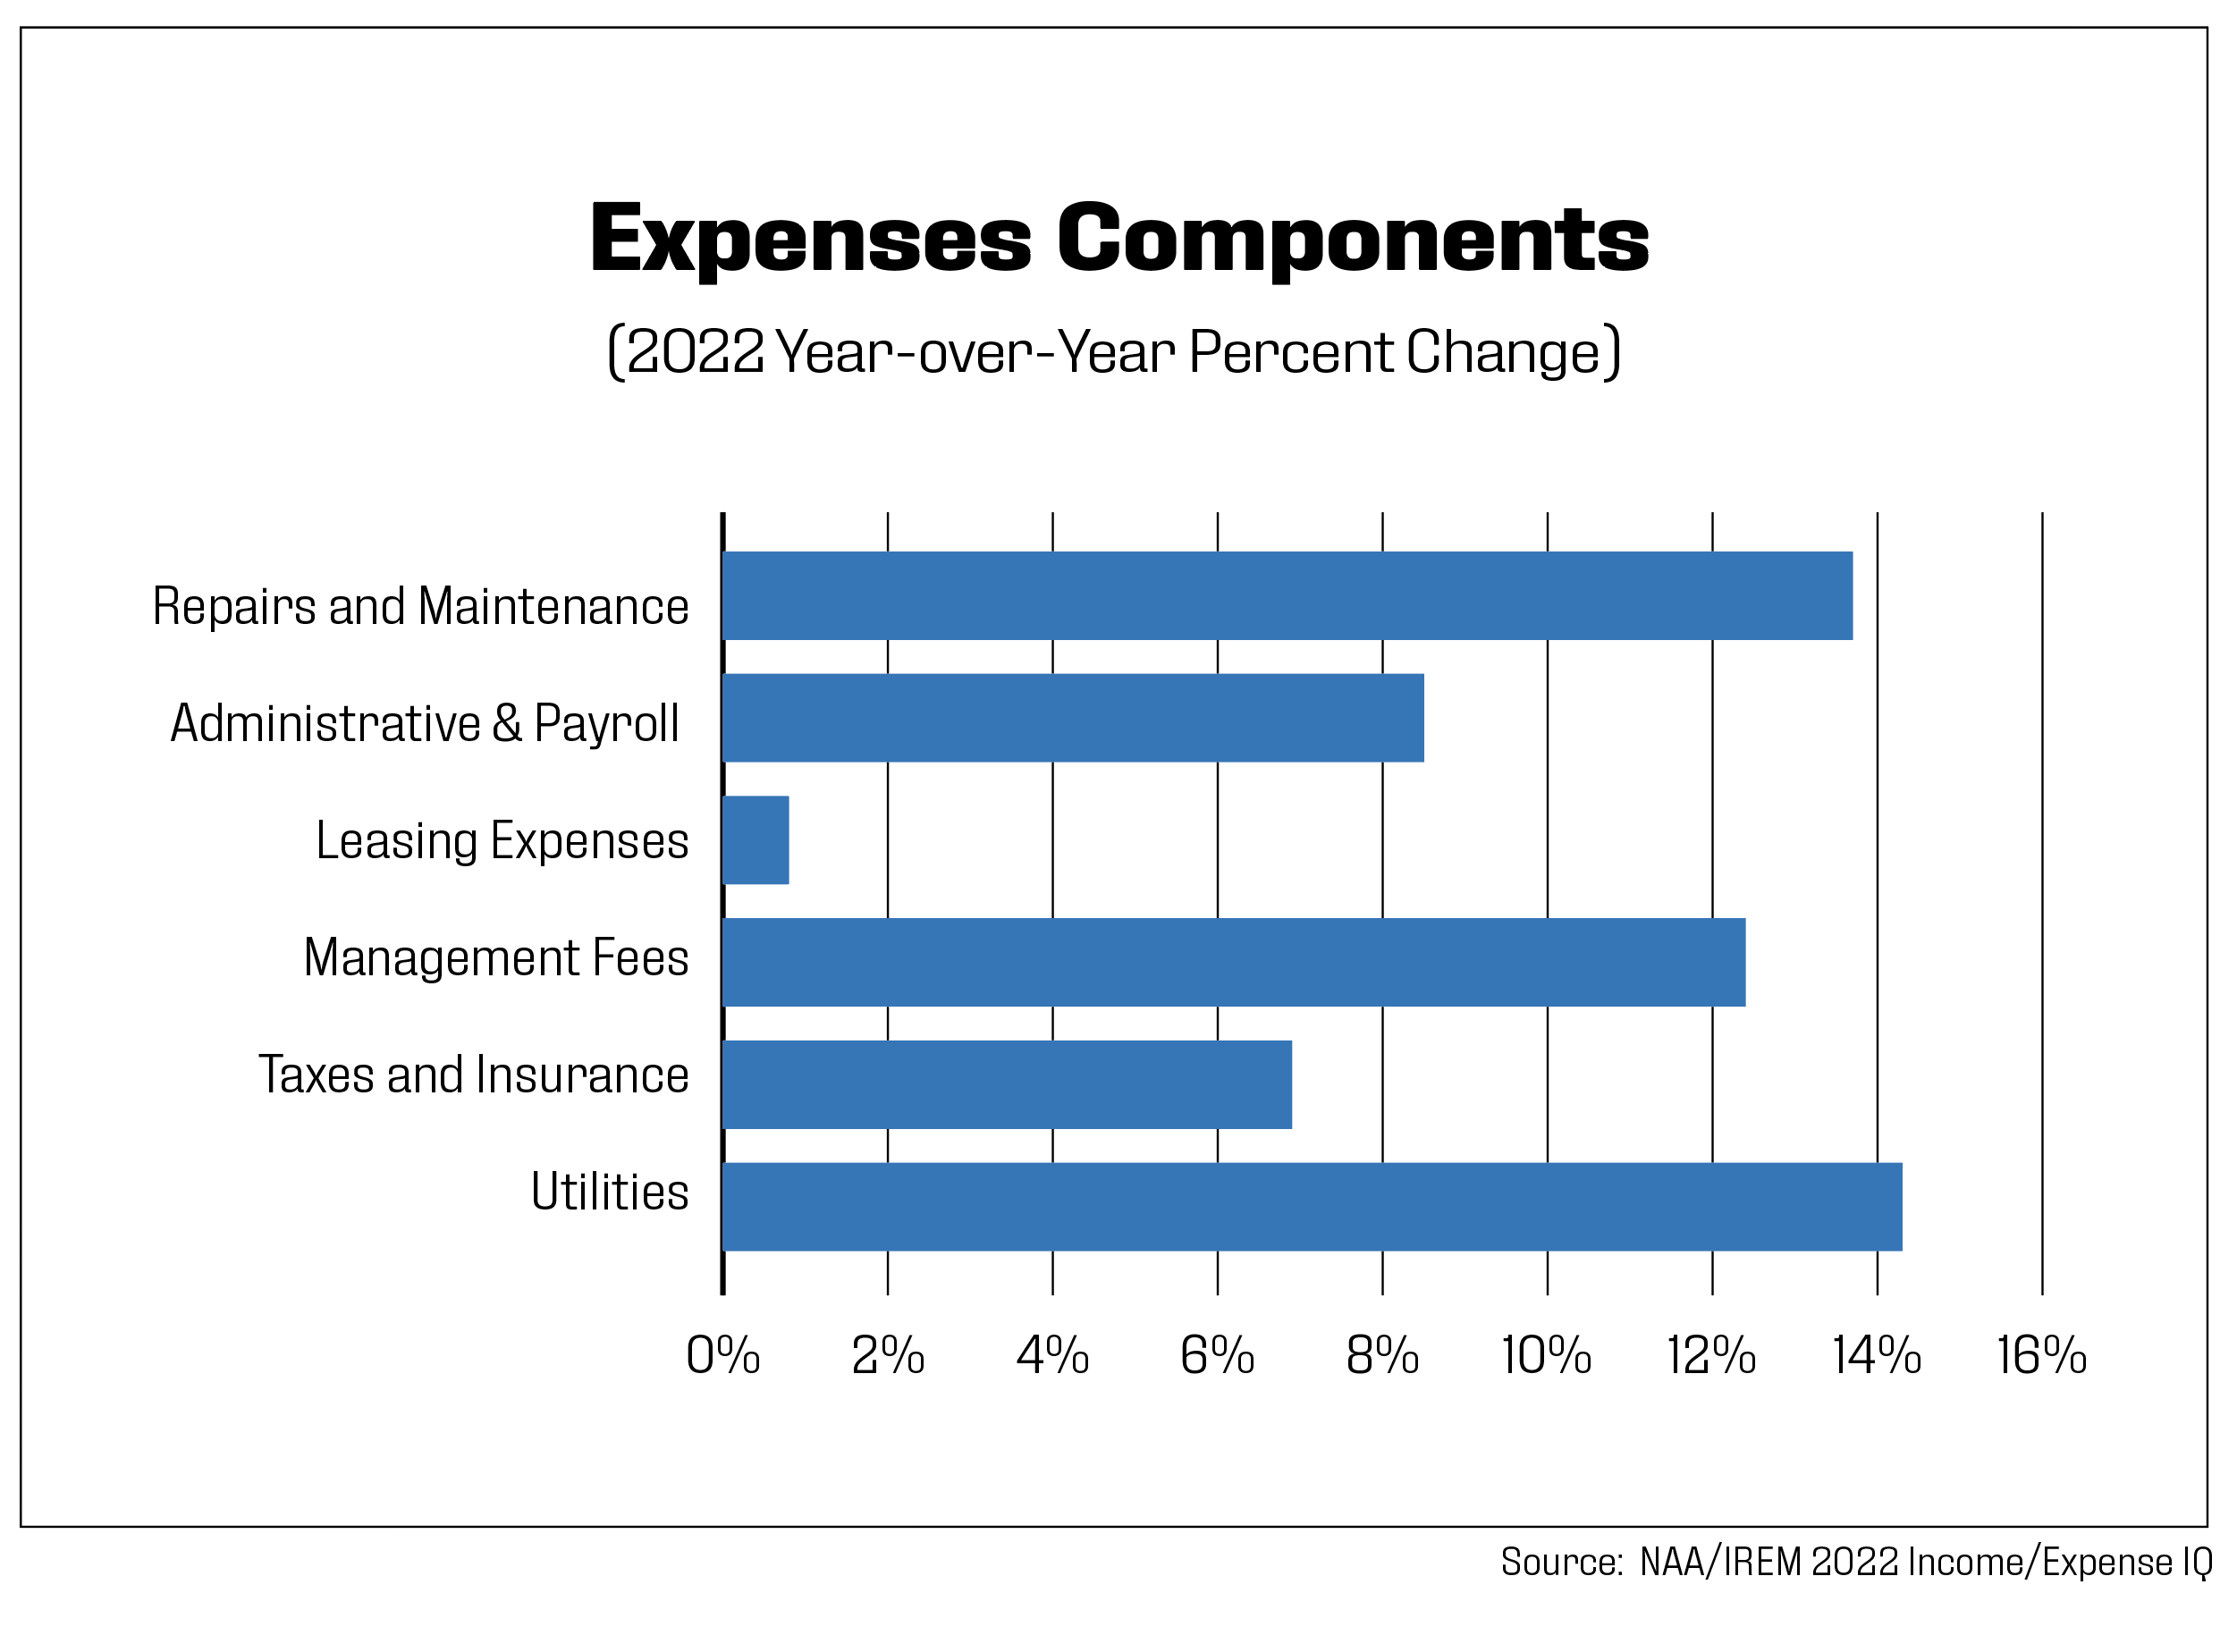
With headline inflation averaging 8.0% in 2022, just about every expense category increased for owners and operators of rental housing. For top-line categories in the benchmarking data, costs for utilities experienced the highest increase, up 14.3% year-over-year. Natural gas and heating fuel came out on top, increasing by 41.8% and 19.1%, respectively, although electricity, internet/wireless and water/sewer all rose by double or near-double digits. Total repairs and maintenance were up 13.7% with a median cost of $950: driven by appliances, painting/decorating, and general repairs, all of which increased by 20% or more. Expenses for general building exteriors and grounds maintenance decreased while costs for carpets and landscaping moderated. Management fees increased 12.4% compared to a 6.2% increase for all services measured by the Consumer Price Index. Property taxes averaged a 6.5% increase, driven by double digit increases in Orlando, Norfolk, Va.; Minneapolis; Riverside, Calif.; and Salt Lake City, among others.
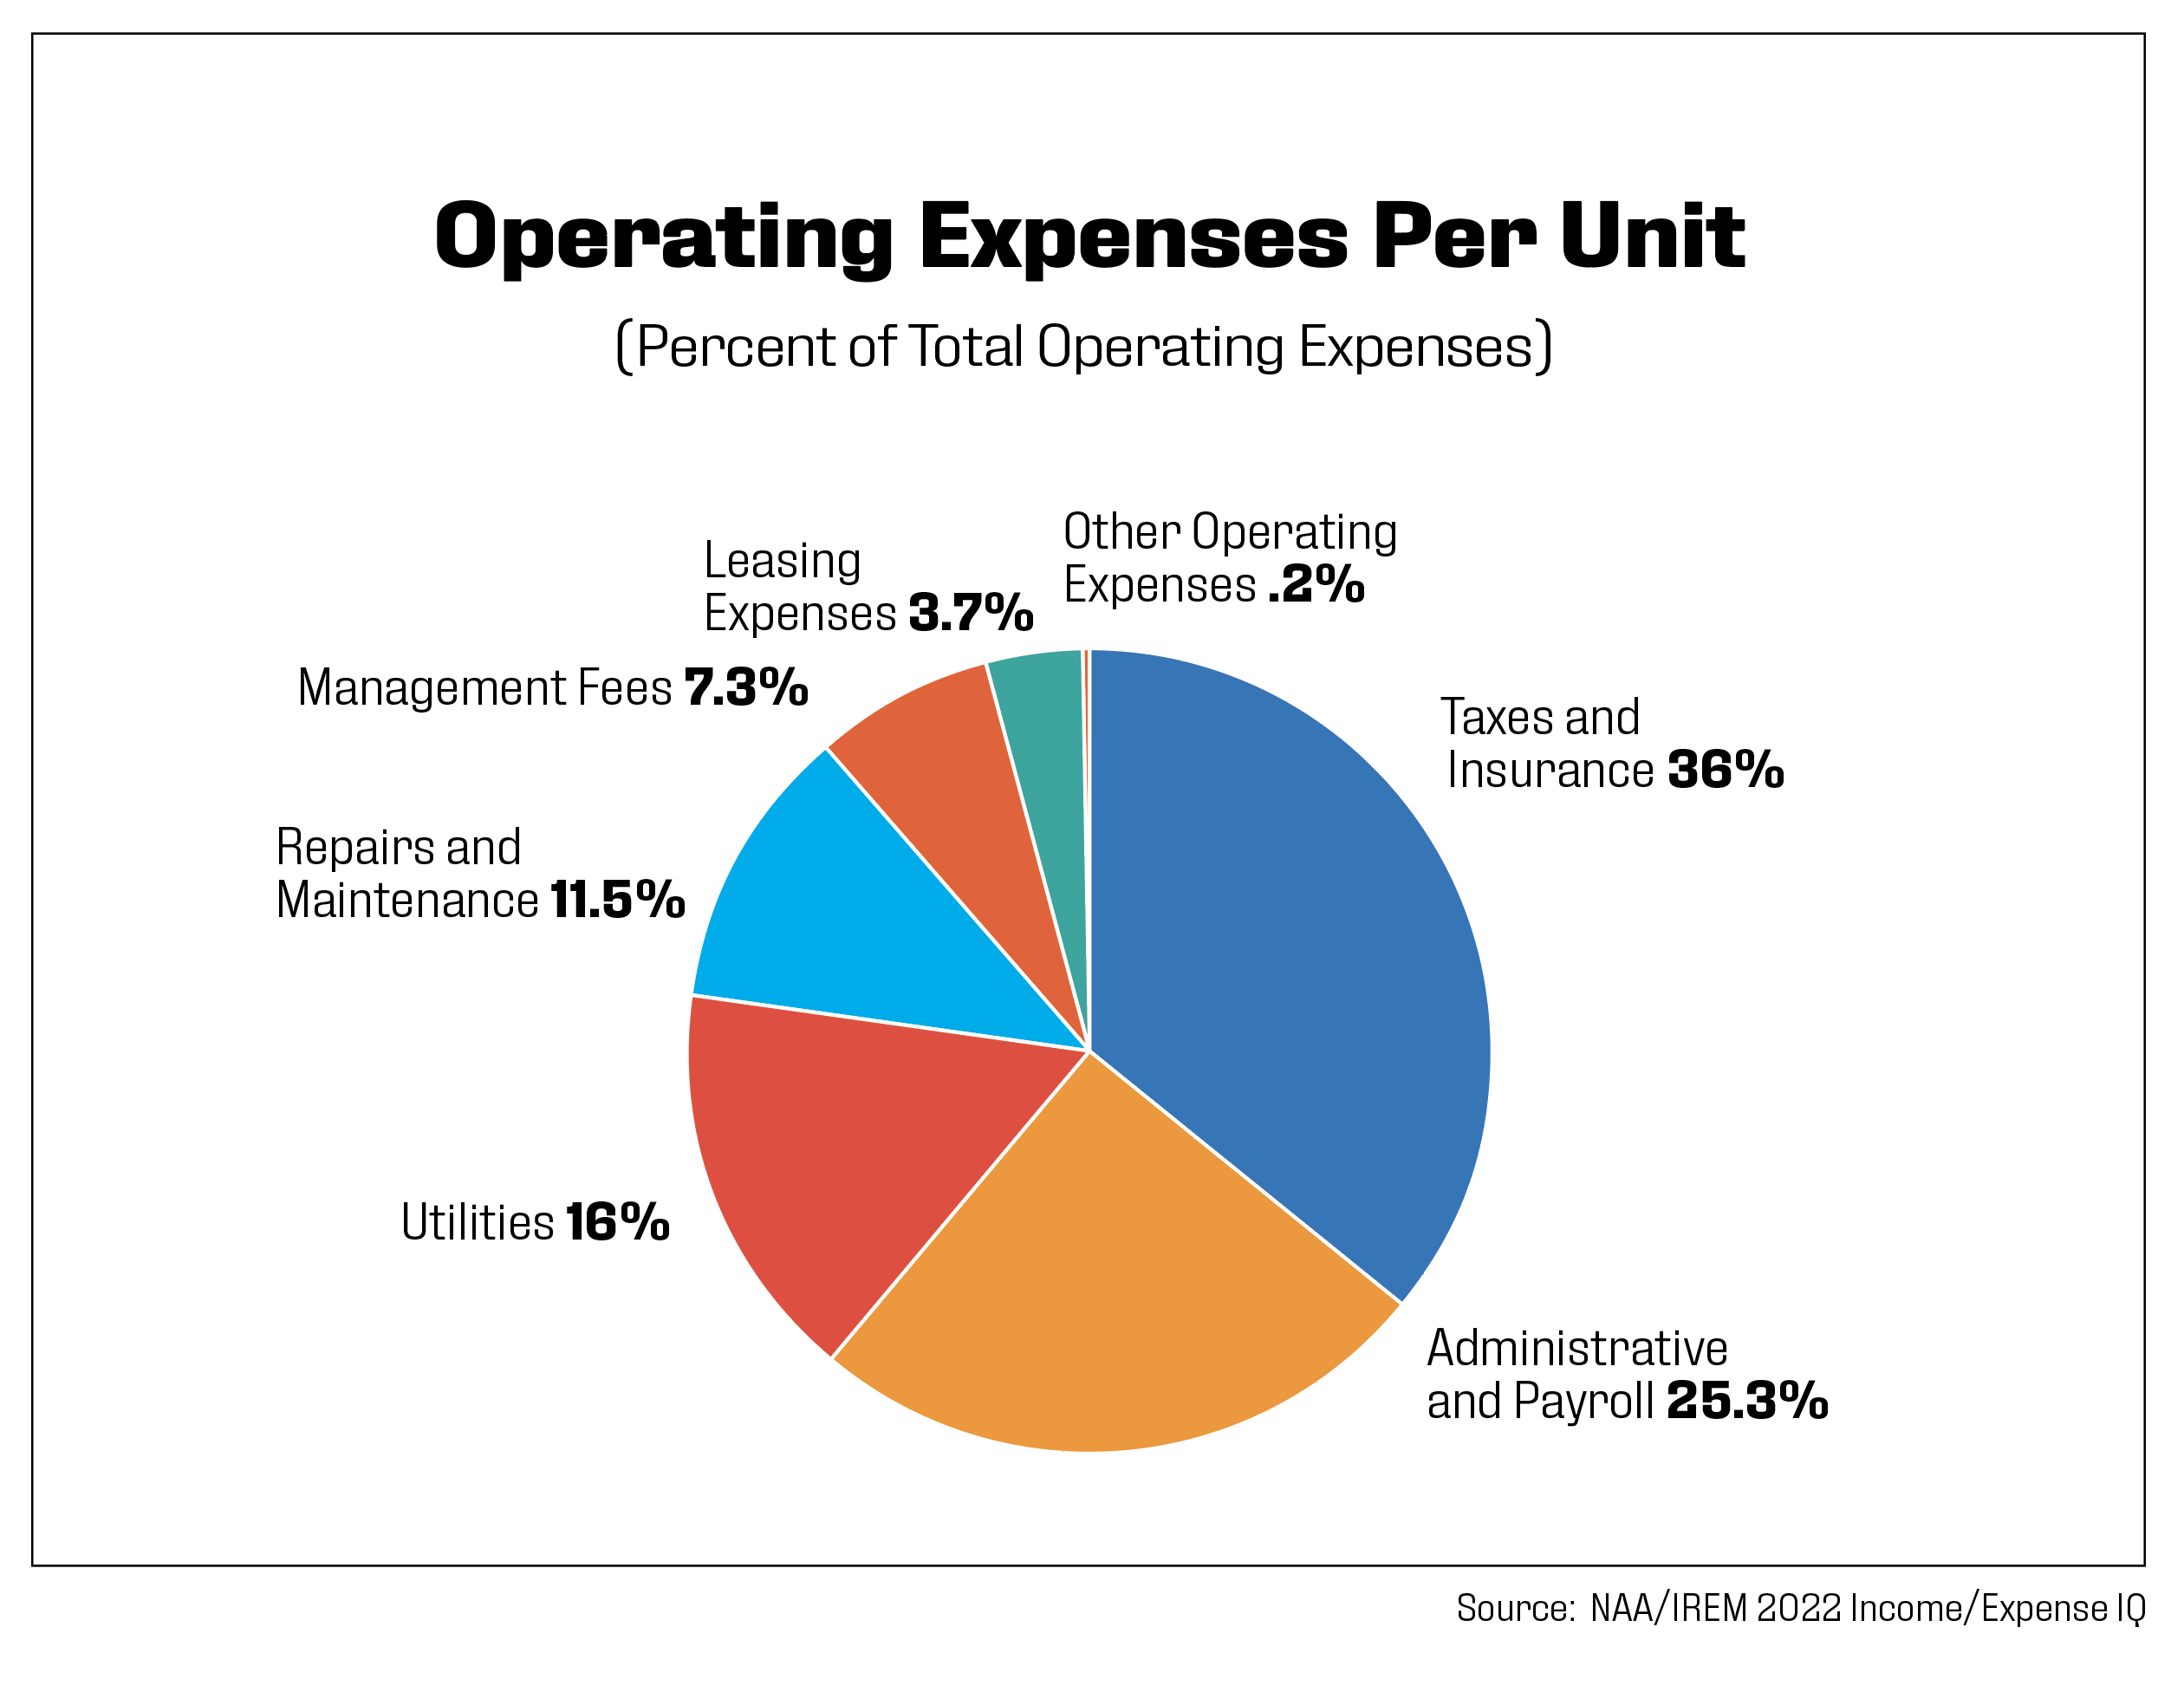
Payroll and other administrative expenses increased by 8.5%, fairly in line with Bureau of Labor Statistics data, which showed a 9.2% increase in wages during the same time period for the industry sector “Lessors of Residential Buildings,” in which much of the apartment industry is classified. Labor market challenges have plagued the industry for years, particularly for onsite staff, but the red-hot job market that was kickstarted by the pandemic recovery and stayed strong through 2022 only exacerbated the problems. Job openings in the broader real estate sector increased 35.5% vs. 12.1% for all nonfarm payrolls. Similarly, a higher percentage of employees in the real estate industry quit in 2022 versus all industry sectors, 16.4% vs. 6.1%, respectively. Enhanced compensation packages, including benefits and bonuses, were just one way owners and operators dealt with labor shortages.
The properties included in this analysis experienced a 9.1% increase in insurance costs. It’s important to remember that this represents pricing in 2022 compared to 2021 and that numerous reports recently released by real estate firms cover 2023 data. Insurance cost increases through Q2 2023 ranged from a low of 18.8% year-over-year as reported by Yardi to a high of 33.0%, according to Marcus & Millichap. Not surprisingly, Florida and California have witnessed the greatest increases in insurance premiums. Of the 10 markets in these two states that Marcus & Millichap analyzed, insurance increases ranged from 27.2% in Los Angeles to 79.1% in Orange County, Calif., while rent growth in these cities measured 3.9% and 2.4%, respectively, during this time.
Conditions were especially challenging for affordable property owners, according to a survey conducted by NDP Analytics on behalf of the National Leased Housing Association. It found that nearly one in three affordable housing providers faced insurance increases of 25% or more in 2023.
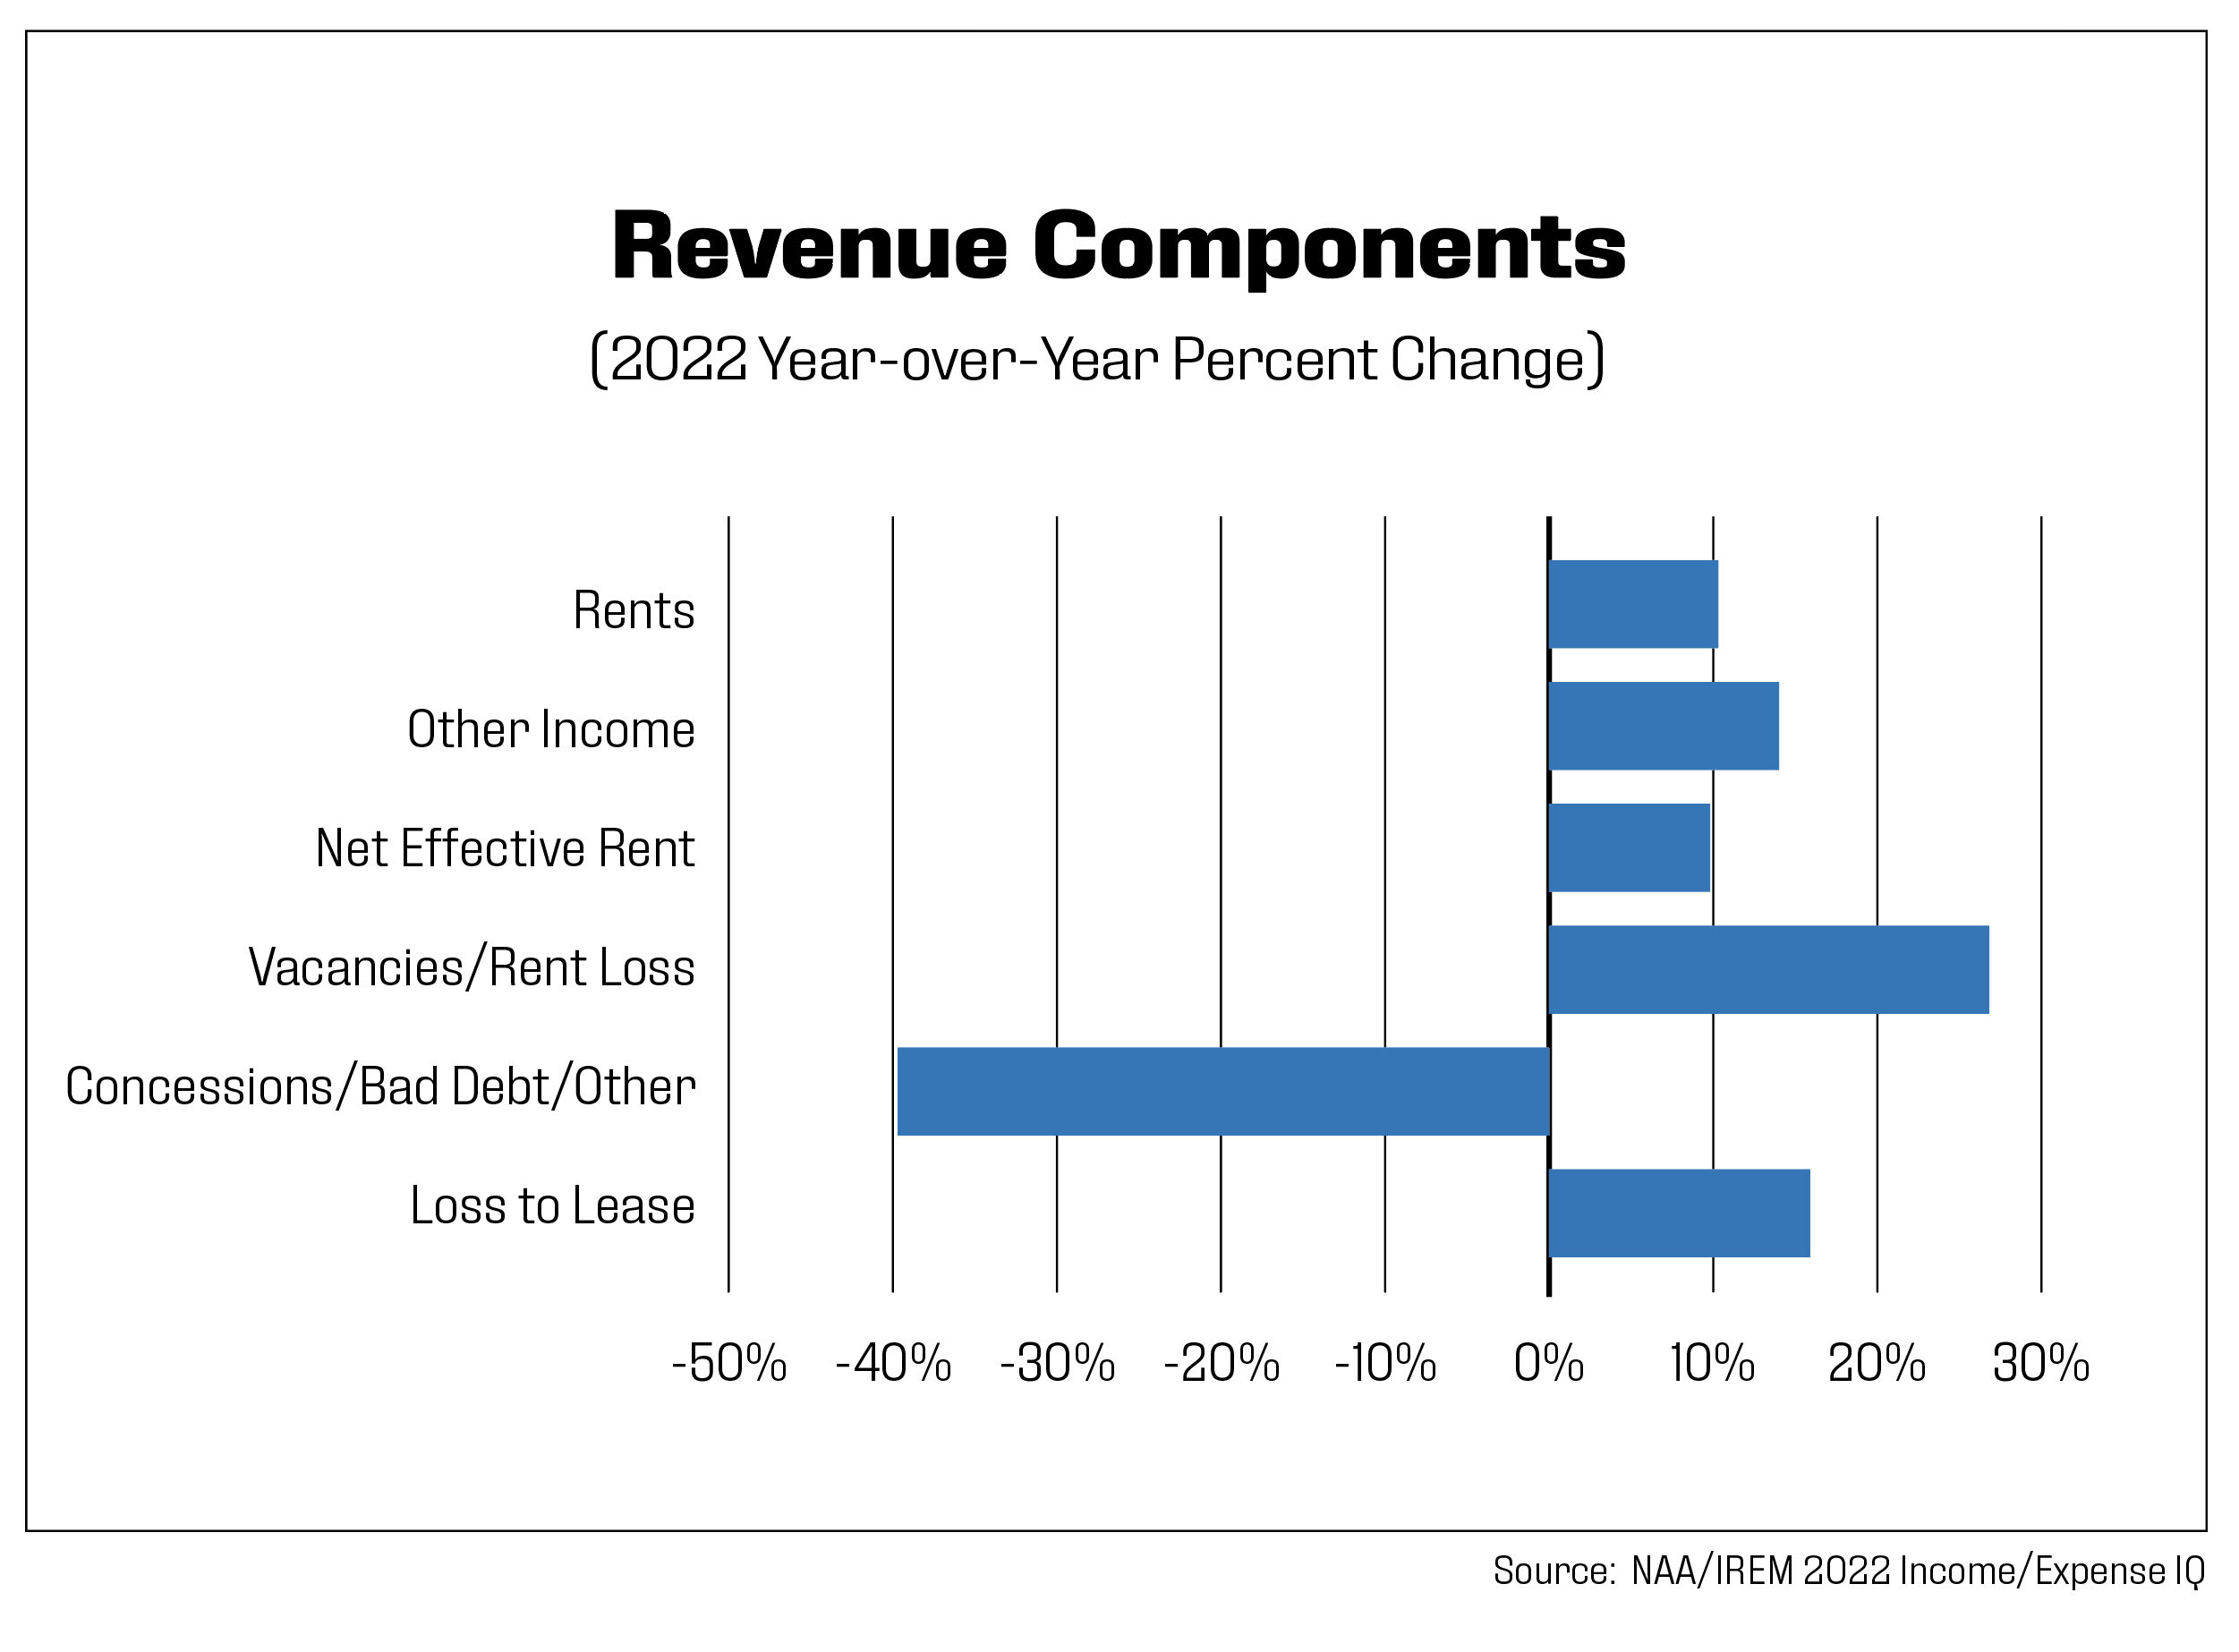
Although rent growth has slowed considerably in 2023, the median rent in this analysis of $1,811 per month showed a 10.3% increase from 2021 to 2022. Loss to lease increased substantially, however, from $95 to $110, a 15.9% increase. Other adjustments to rent that worsened were losses due to vacancies, increasing by 26.8%, and bad debt, up 22.9%. Concessions being mainly a 2023 phenomenon, decreased in 2022. All told, net effective rent experienced a 9.8% increase. Ancillary income rose 14.0% resulting in total income growth of 10.1%. Net operating income increased by 10.8%, a figure we know from both other data sources and anecdotally, will decrease dramatically by the end of 2023.
Metropolitan Area Overview
The full 2022 Income/Expense IQ provides apartment benchmark data for over 100 metropolitan areas. The benchmarking data analysis in this summary focuses on same store data in the top 25 metro areas, each of which contains more than 30 properties. This section highlights the year-over-year trend breakdown of revenue, operating expenses, and net operating income for the metro markets.
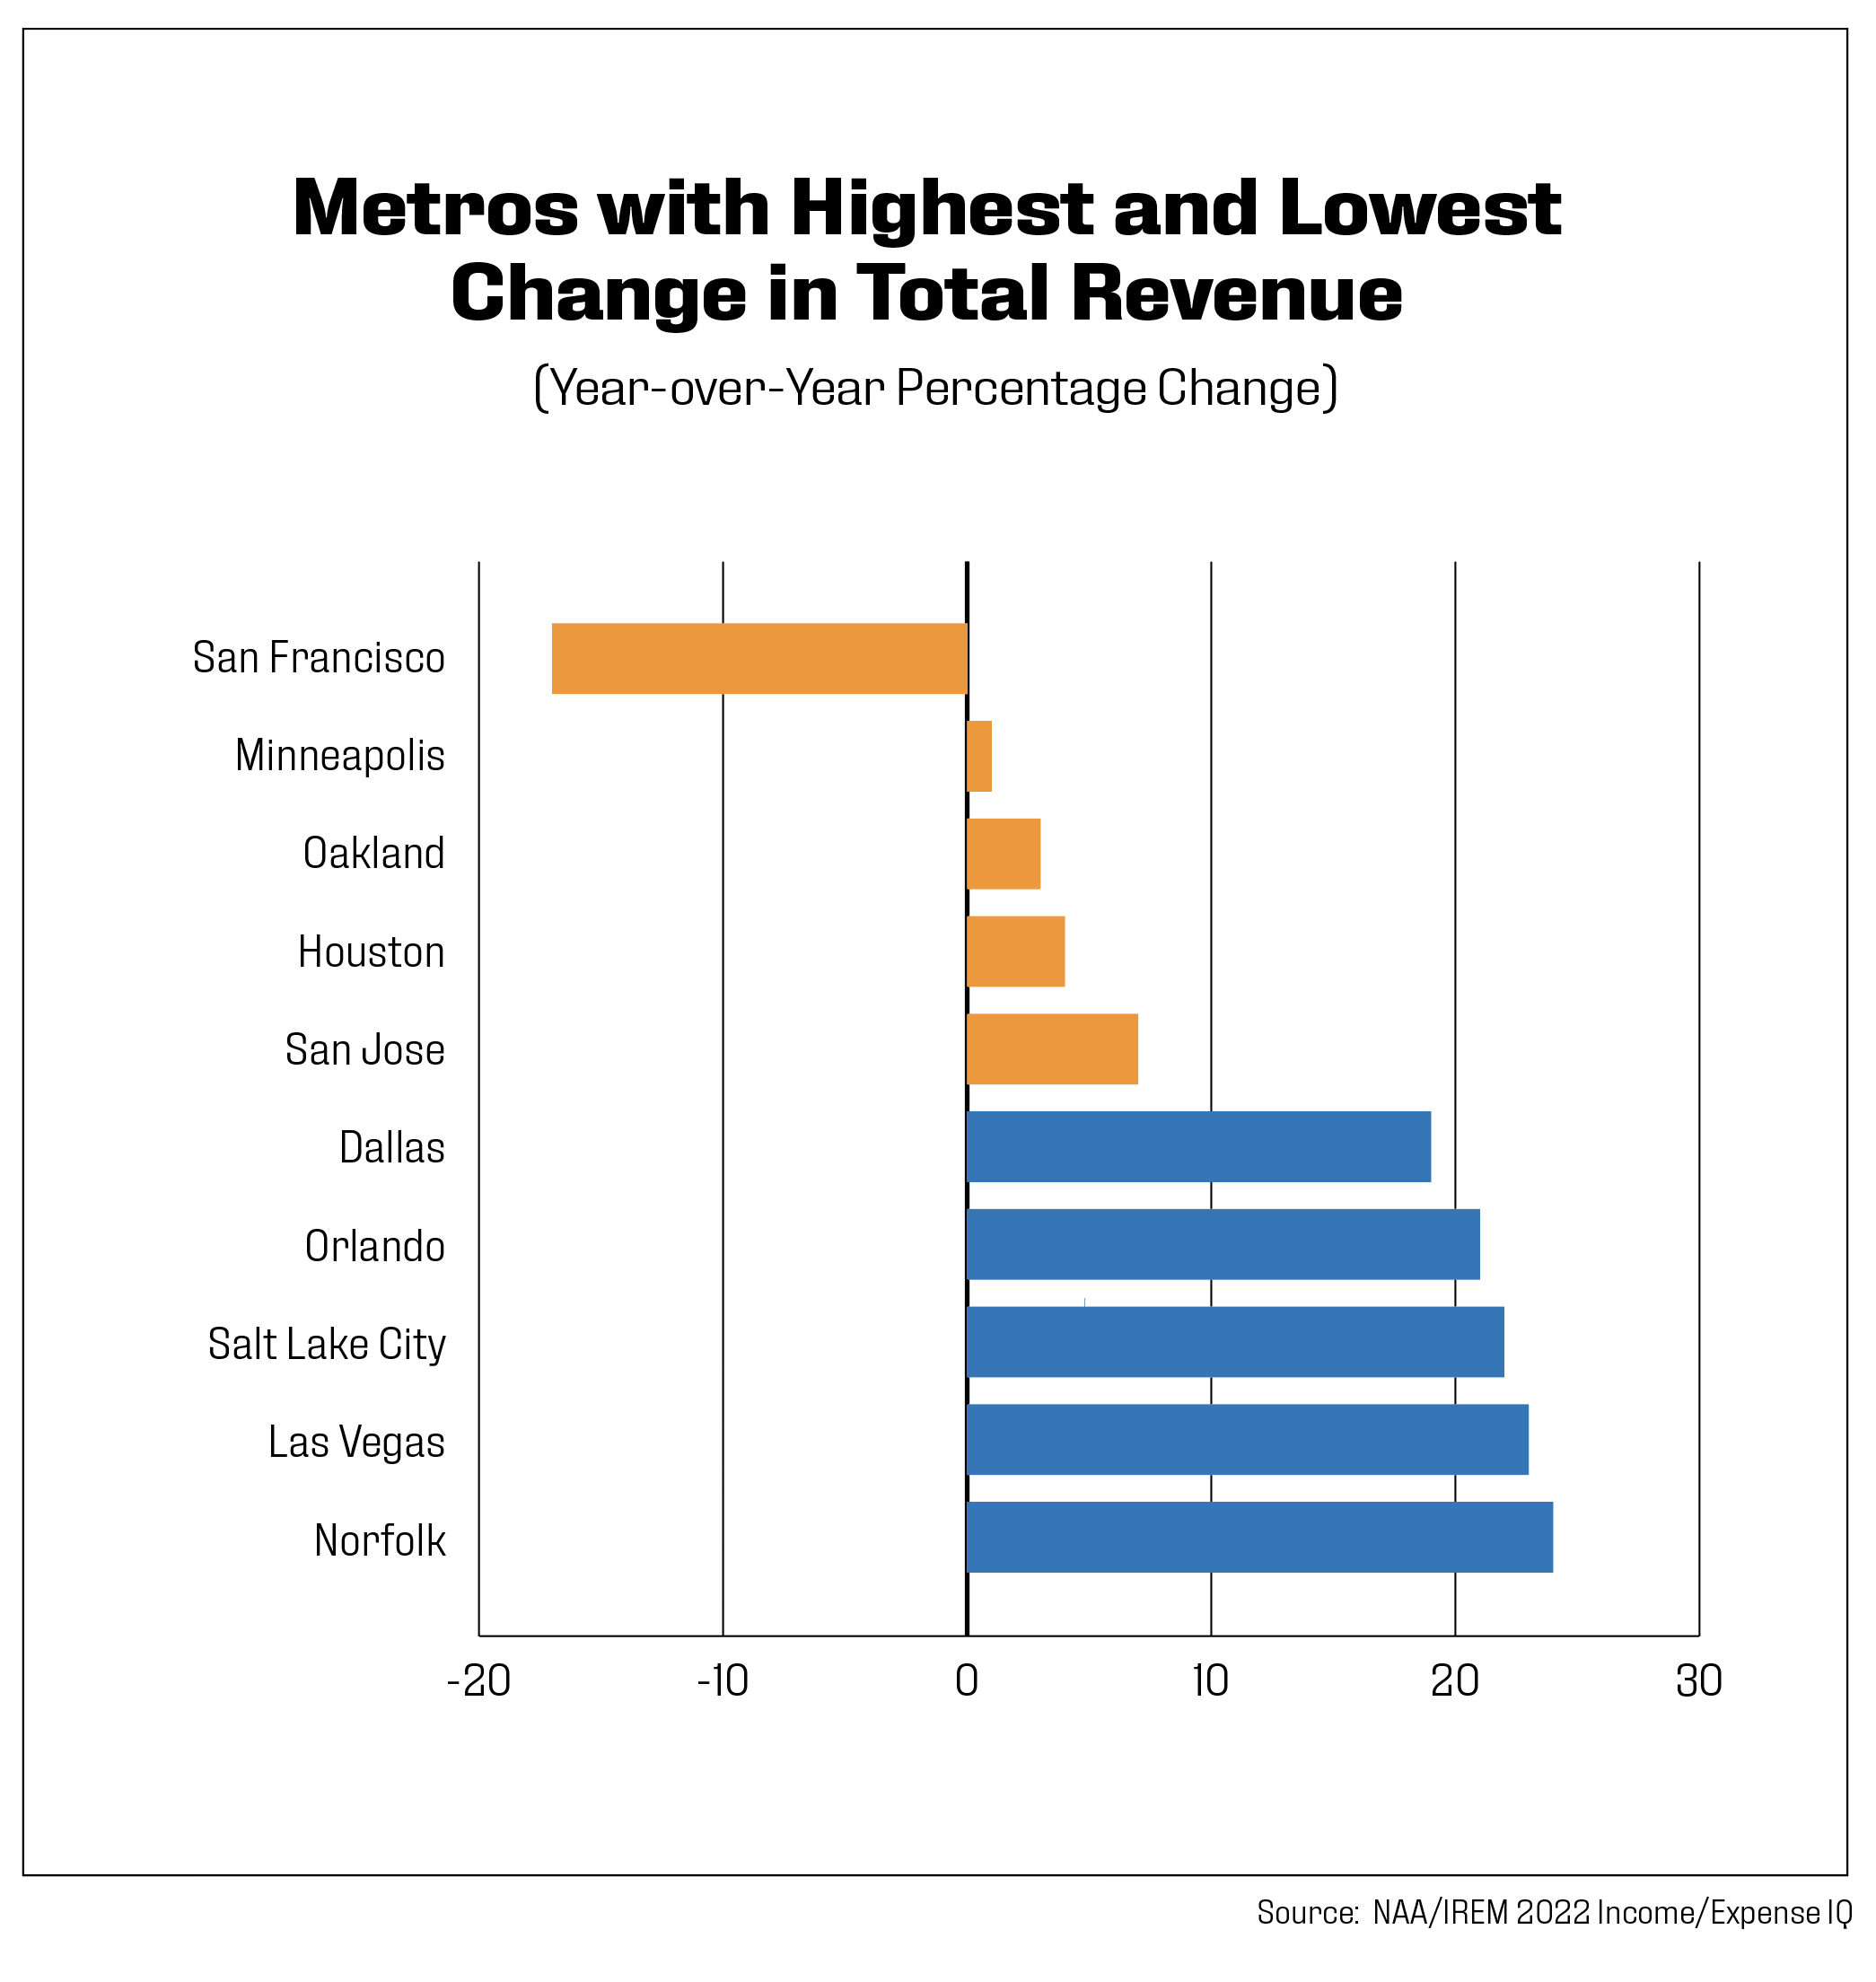
All but one market experienced positive growth in the annual revenue generated. Total revenue in 2022 dropped by 17.2% in San Francisco, fueled by increased remote work opportunities that gave people the freedom to migrate to other cities. The top markets for revenue growth were Norfolk, Las Vegas, Salt Lake City, Orlando, Dallas, with the growth ranging from as high as 24.5% to 19.3%. Rent increases, higher parking fees and lower concessions are factors that led to higher revenue generation in those markets.
On the other hand, Minneapolis; Oakland, Calif.; Houston; and San Jose, Calif.; ranked the lowest in revenue growth after San Francisco, ranging between 1.5% and 6.6%. This lower growth was ascribed to increases in vacancies, rent losses and bad debts.
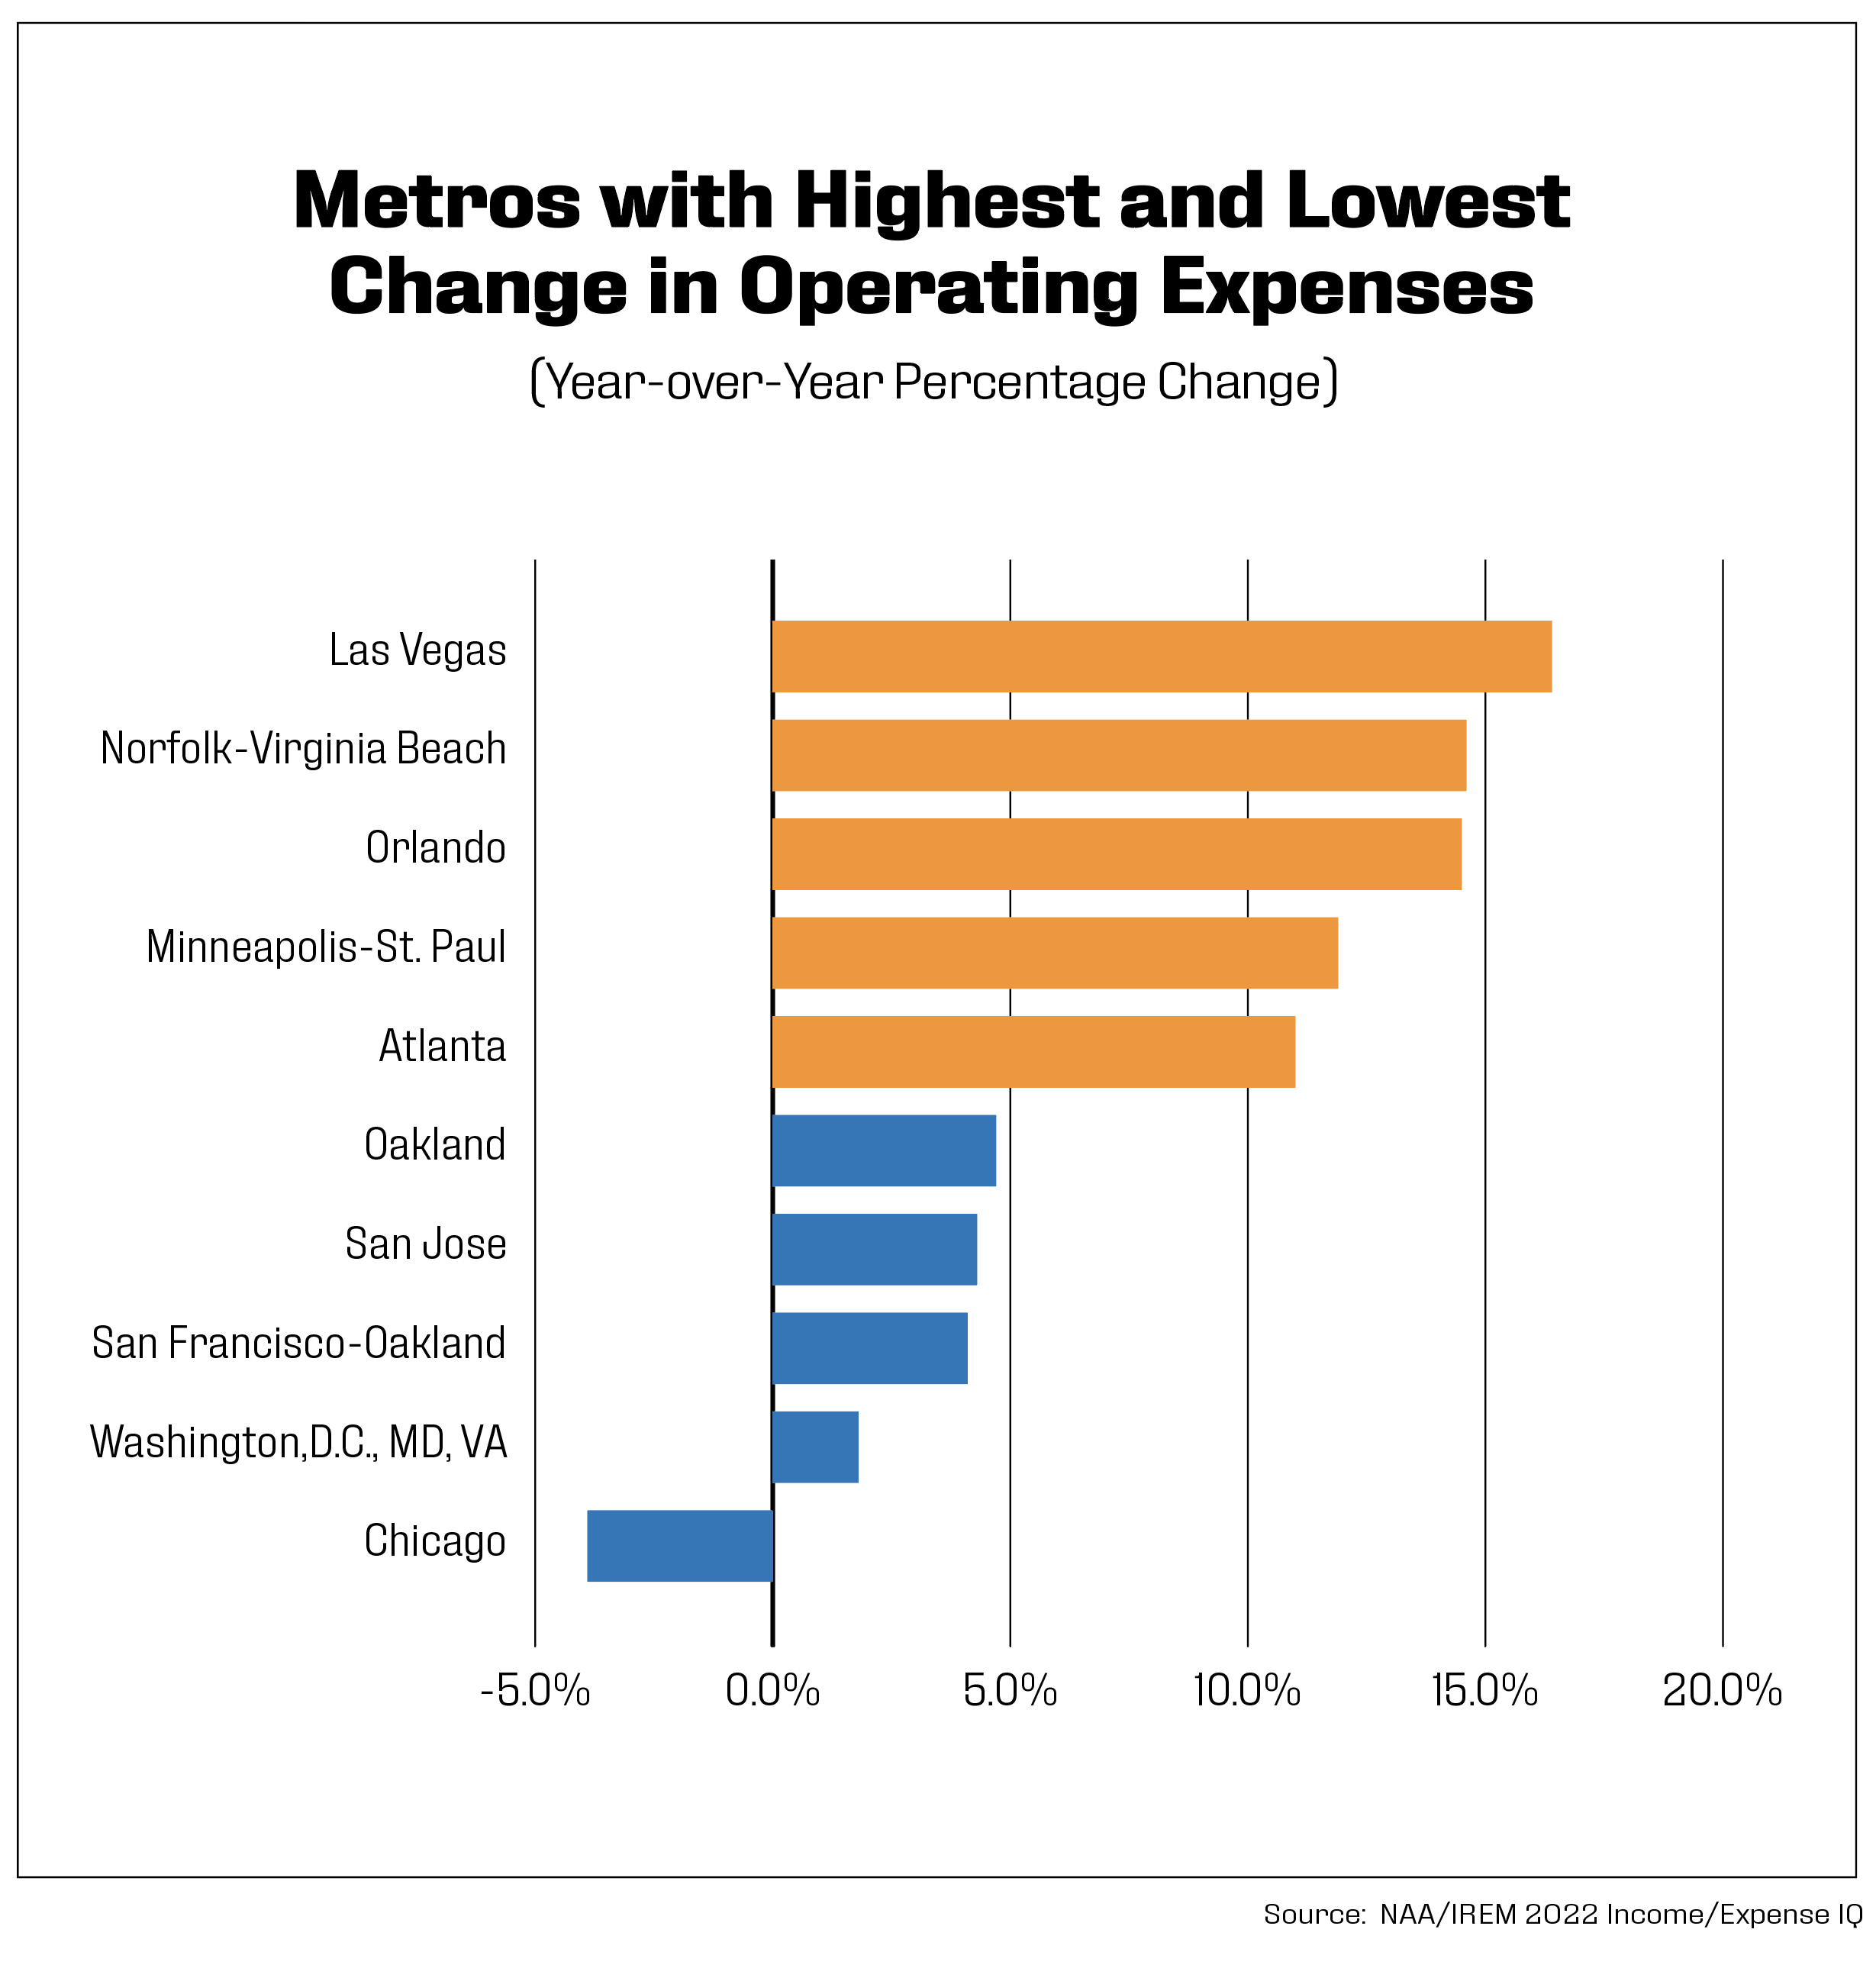
Operating expenses ranged from as high as $17,608 per unit in San Francisco to as low as $5,470 per unit in Las Vegas. About 96% of the markets analyzed for this report experienced a year-over-year increase in operating expenses, with the leading markets being: Las Vegas (16.4%), Norfolk (14.6%), Orlando (14.5%), Minneapolis (11.9%), and Atlanta (11.0%). The increased cost in these markets was attributed to the rising cost of natural gas, water and sewer, repairs and maintenance, and electricity.
The markets that observed the lowest year-over-year change in operating expenses had a combination of positive growth in San Jose (4.3%), San Francisco (4.1%), and Washington, D.C. (1.8%), and a negative growth of 3.9% in Chicago. The decline in costs was traced to lower leasing expenses; however, the reduction in Chicago’s operating expenses was specifically due to declines in security services costs.
Net Operating Income (NOI) in 2022 varied from $23,216 in San Francisco to $3,662 in Minneapolis. The top three markets experiencing high growth in net operating income were Norfolk, Dallas, and Salt Lake City, with growth rates of 36%, 29.5%, and 28.5%, respectively. On the opposing side, three markets experienced negative growth levels in NOI: Houston (-0.3%), Minneapolis, (-18.3%), and San Francisco, (-28.3%). While the income per unit for Norfolk, Dallas and Salt Lake City rose, markets with negative growth in NOI experienced low revenue growth coupled with higher cost of expenses.
Outlook
At the time of this writing in Q4 2023, the industry had gone through ups and downs throughout the year. Demand picked up somewhat, leading to positive absorption, but rent growth was sluggish in the best performing markets and negative in the worst. Multiple reports on expenses during the past several months revealed that 2023 was another difficult year in which to operate apartments. Yardi reported an average increase of 9.3% in expenses for the 12 months ending June 30, 2023, with insurance, repairs/maintenance, administrative and payroll topping the list. On the revenue side, RealPage was tracking falling revenue in more than half of the 150 markets they track through Q3 2023, teeing up 2024 as another challenging year. The regulatory environment, which remains heated, will only exacerbate these challenges.
If the U.S. avoids recession, interest rates begin to decrease, and the labor market can muster some growth; the apartment industry will be able to weather these difficulties with an eye on the long-term. Solid fundamentals and demographics, and the relative affordability of rentals, also work in the industry’s favor.
About the Income/Expense IQ
NAA, IREM, and BOMA have partnered with Lobby CRE to provide comprehensive income and expenses benchmarking data for the apartment sector in a simplified digital format. Data for the 2022 Income/Expense IQ were reported to have multifamily benchmarks for more than 4,546 conventional properties containing 1,026,974 units. Benchmarks are based on 2022 operating data provided by NAA and IREM members and other real estate practitioners. Currently, there are multifamily benchmarks available for 108 U.S. metro markets. The benchmark data is presented in three forms: Total dollar amount, dollars per unit and dollars per unit as a percentage of income.
Income/Expense IQ features and benefits include:
In-platform comparisons
Configure your property’s T12s in monthly, quarterly, annual or custom-defined periods and compare them to a benchmark in real-time.
Filtering
Tailor your filters to ensure the benchmark, and its results, accurately reflect your property’s attributes.
Collaboration
Get your team on the case by inviting team members to the platform to collaborate, share data insights, and spot areas where you can improve.
Live benchmarks
Income/Expense IQ technology recalculates benchmarks monthly to ensure newly added property data is captured. This allows you to unlock more granular benchmark configurations as the data pool increases.
Automated submission
With the new Income/Expense IQ tool, you can securely submit data to gain access to additional platform features. And submitting data doesn’t require manual spreadsheets and emailed data. Schedule reports from property management software (PMS) to upload automatically to the platform.
View More Information on the Income/Expense IQ
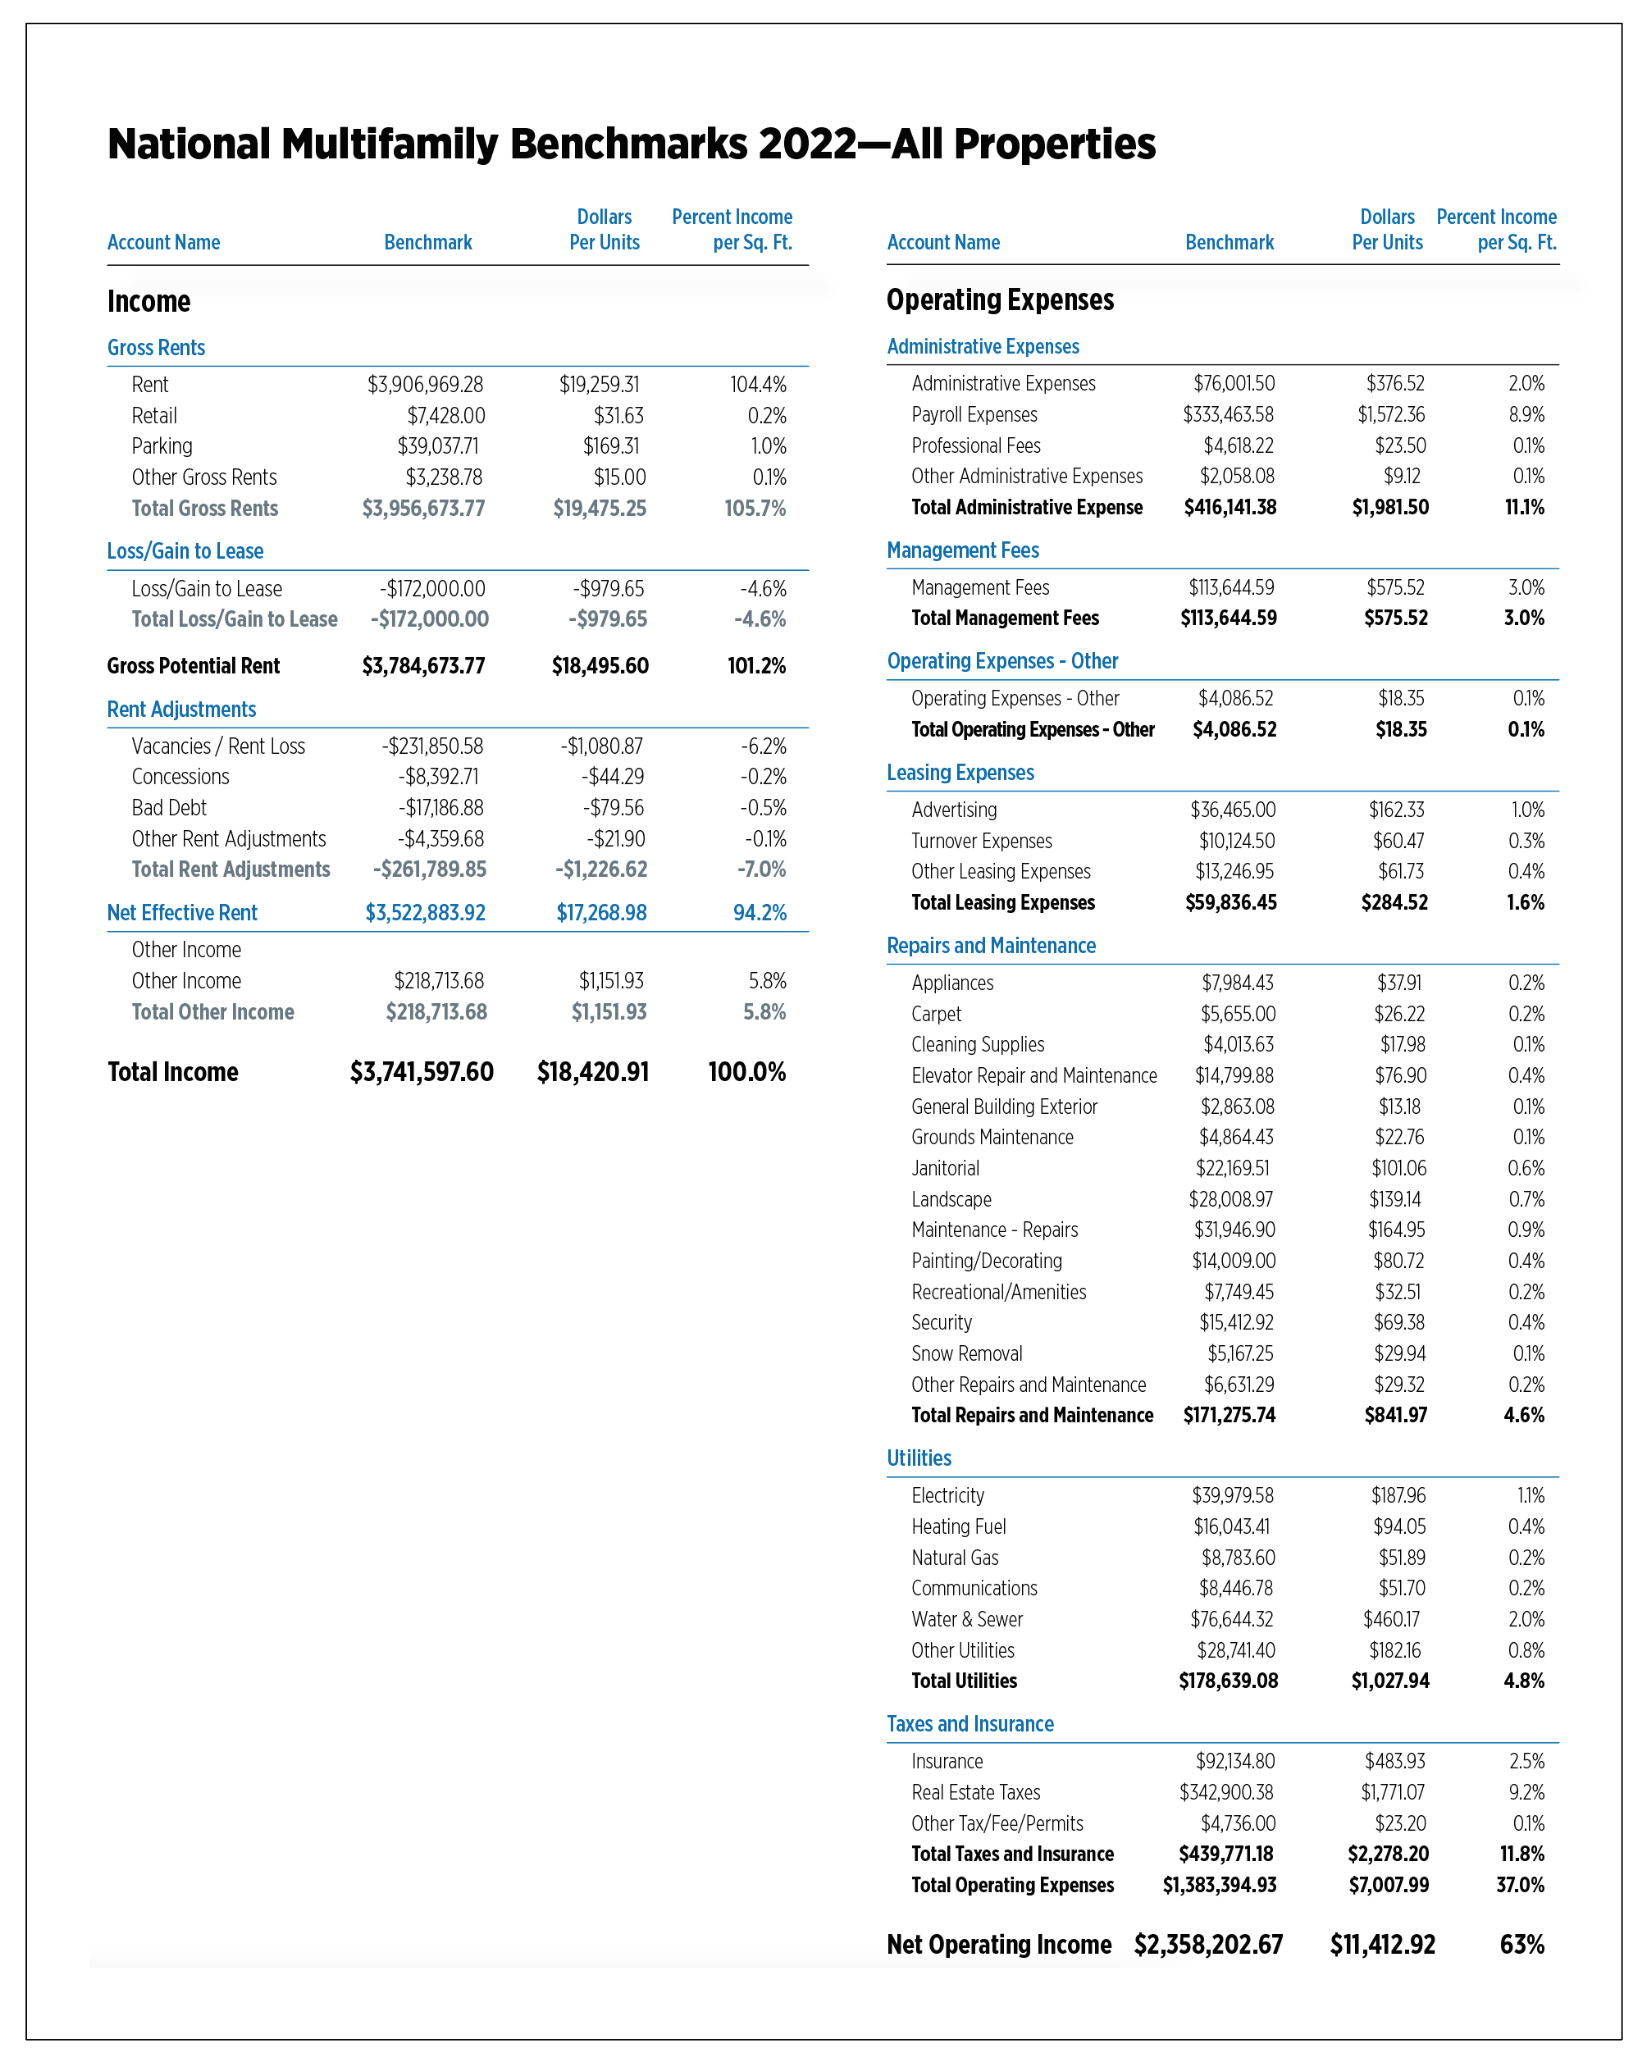
National Multifamily Benchmarks 2022 – All Properties
Glossary of Terms
Administrative. Total monies spent on general and administrative items such as mileage reimbursement, bank charges, legal/eviction charges, postage, office supplies, uniforms, credit reports, permits, membership dues, subscriptions, data processing, etc. Does not include any payroll-related expenses.
Other Administrative Expenses. Any administrative expenses that cannot be attributed to the included list of administrative expense line items.
Communications. Total monies spent on communication utilities such as telephone, internet and wireless services.
Contract Services/Professional Fees. Payments to vendors for services rendered. Trash services should be included under “other utilities.”
Gross Potential Rent. Total rents of all occupied units at year of submission lease rates and all vacant units at year of submission market rents (or fiscal year end).
Heating/Cooling Fuel. Type of fuel used in apartment units.
Insurance. Includes property hazard and liability and real property insurance and does not include health/payroll insurance.
Leasing Expenses. Includes marketing/advertising, turnover expenses and other leasing expenses.
Other Leasing Expenses. Any leasing expenses that cannot be attributed to the included list of leasing expense line items
Loss/Gain to Lease. Difference between actual contract rents and market rental rates.
Management Fees. Total fees paid to the management agent/company by the owner.
Marketing/Advertising. Includes all marketing and advertising expenses for the property.
Net Commercial Square Footage. Total rentable square feet of commercial floor space.
Net Rentable Residential Square Feet. Total rentable square feet of floor space in residential units only. Area reported includes only finished space inside four perimeter walls of each unit. Common areas are excluded.
Payroll Expenses. Gross salaries and wages paid to employees assigned to the property in all departments. Includes payroll taxes, group health/life/disability insurance, 401(k), bonuses, leasing commissions, value of employee apartment allowance, workers’ compensation, retirement contributions, overtime and other cash benefits.
Rental Revenue Commercial/Other. Total rent collections for any commercial space after vacancy/administrative, bad debt and discount or concession losses.
Rental Revenue Residential. Total rent collections for residential units.
Other Rent Adjustments. Any rent adjustments that cannot be attributed to vacancy, concessions or bad debt.
Repairs and Maintenance. Total monies spent on general maintenance, maintenance supplies and uniforms, minor painting/carpeting repairs, plumbing supplies and repairs, security gate repairs, keys/locks, minor roof/window repairs, HVAC repairs, cleaning supplies, etc. Does not include any payroll-related expenses or non-recurring capital expenses. Contract services are reported separately.
- Appliances
- Carpet
- Cleaning Supplies
- Elevator Repair and Maintenance
- General Building Exterior
- Grounds Maintenance
- Janitorial
- Landscape
- Painting/Decorating
- Recreational/Amenities
- Security
- Snow Removal
- Other Repairs & Maintenance
Other Revenue/Income. Monies received, including amenity fees, parking fees, laundry, pet fees, storage and “other”). All “other” would include the sum of any items not specifically listed above (e.g., vending, deposit forfeitures, furniture, late fees, termination fees, application fees, etc.). NOTE: Interest income or utility reimbursements are not included. (Utility reimbursement/recovery is subtracted from gross utility costs.)
Revenue Losses/Adjustments to Collections/Bad Debt. Amount of residential rents not received due to collection losses.
Revenue Losses/Adjustments to Concessions. Amounts of gross potential residential rents not received due to concessions.
Revenue Losses/Adjustments to Vacancies. Amount of rental income for residential units not collected because of vacancies and other use of units, such as models and offices.
Taxes. Total real estate and personal property taxes only. Does not include payroll or rendering fees related to property taxes or income taxes.
Other Taxes, Fees, Permits. Any permit costs, fees or taxes, outside of property tax. Does not include payroll taxes.
Total Operating Expenses. Sum of all operating costs. The sum of all expense categories must balance with this line, using total net utility expenses only. Does not include debt service or any one-time extraordinary costs or capital costs.
Paula Munger is NAA’s Vice President, Research.
Erioreoluwa “Eri” Bajomo is NAA’s Industry Research Analyst.