From helipads to breweries to concierge services that can just about read a resident’s mind, amenities have been a hot topic in the apartment industry for years, and the bar just keeps getting higher. For apartment owners and operators who have neither the capital nor even the demand for these over-the-top features, there are plenty of ways to increase their communities’ appeal through amenities, many of which are simple to implement and require little up-front investment. This report seeks to identify top amenities in their communities nationwide and in 11 selected cities, at both the community and unit level, and which ones have the greatest impact on revenue.
An analysis of major renovations and their effect on rent and occupancies is also included.
This NAA Research study included 43 unique amenities, added or upgraded from January 2014 to September 2016. The universe of survey responses totaled more than 100,000 units in 35 states.
At the property level, half of the top 10 amenities added or upgraded since 2014 involve bringing people together — the community aspect of apartment living that is a draw to so many apartment residents. Clubhouses and common areas for socializing made the top five, with swimming pools, outdoor kitchens and play areas also proving popular.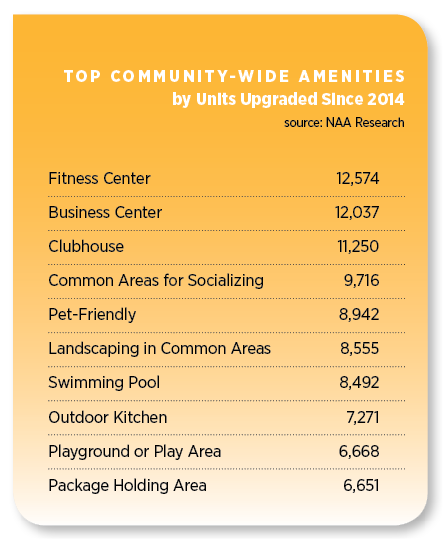
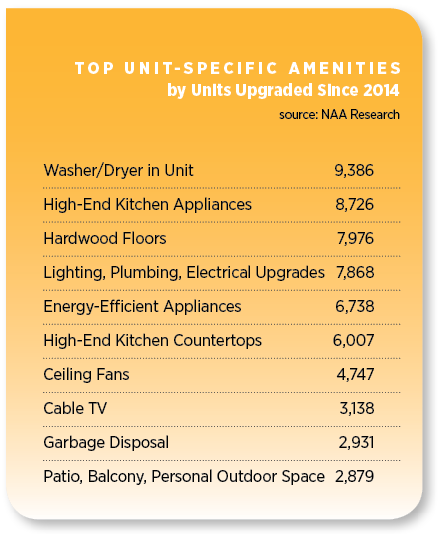
At the individual residence level, washers and dryers were by far the most common feature that owners chose to add or upgrade, followed by high-end appliances and hardwood floors. Lighting, plumbing or electrical improvements and energy-efficient appliances were also near the top of the list.
Amenities Value
Median cost information should be approached with careful consideration. Aside from location, which is one of the most important variables determining costs, upgrading an already-existing amenity versus adding a new one could have vastly different price tags. When ranked, clubhouse costs came out way ahead of other common area amenities.
It’s important to note that clubhouse features also vary widely, and could be anything from a rentable party space with few amenities to pool tables, large-screen televisions and fully built-out kitchens.
Overall, community-wide amenities garnered higher average rent increases of $77 per unit compared to $52 for unit-specific upgrades. Pet-friendly amenities had the greatest impact on rent increases, and with a relatively low cost to implement, clearly offer the best bang for the buck. Fitness centers, swimming pools, common areas for socializing and outdoor kitchens also played a role in adding value. Although business centers remain a commonplace amenity, ranking second during the past few years, they have little impact on rents and also fell farther down the cost scale among the survey respondents.
Likewise, package-holding areas came at a relatively small price tag, but have become such an expected amenity that their value add is limited.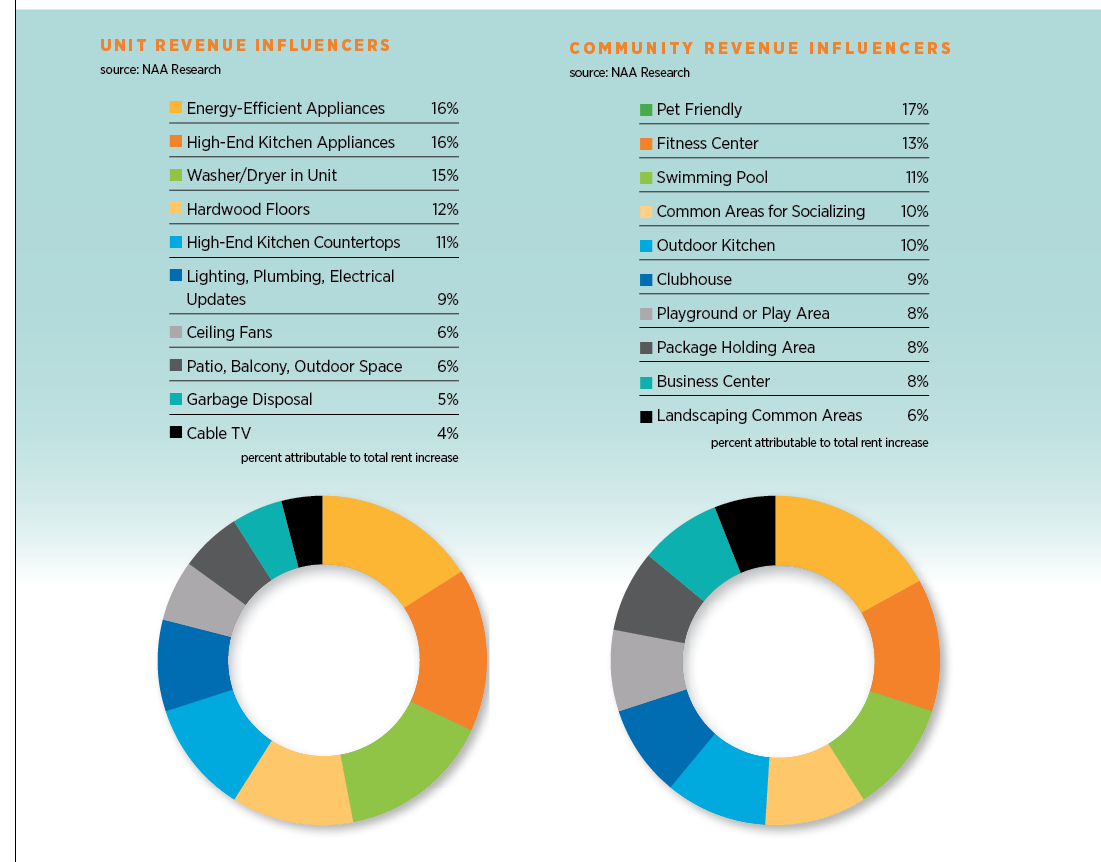
Of the individual unit amenities, the kitchen rules, being the location for half of the top 10 most-common amenities over the past several years. Appliances and hardwood floors carried the greatest costs among survey respondents, with ceiling fans and garbage disposals a low-cost, yet common upgrade.
Impacts on rent increases were nearly equally divided among energy-efficient appliances, high-end kitchen appliances and washers and dryers in the units, each attributable for 15 percent to 16 percent of revenue enhancement. With costs averaging almost 60 percent less than energy-efficient appliances, washers and dryers clearly offer the greatest return on investment.
City Analysis by Enodo Score
Although the information collected in the NAA survey revealed high-level amenity trends at the national level, survey research inherently has its limitations, not the least of which is lack of market coverage for some major metropolitan areas. In addition, the scope of upgrades can vary substantially between markets, and the materials used for certain upgrades cannot always be clearly articulated through a survey instrument. Also, much of the data gathered relies on participants’ subjective opinions of which value-add amenities had the greatest impact — and these opinions may or may not be the true source of value as perceived by the residents actually renting these units.
To overcome some of these limitations, NAA worked with Enodo Score, a real estate predictive analytics company, to provide a more objective, data-driven assessment of which amenities deliver the highest return on investment in various markets.
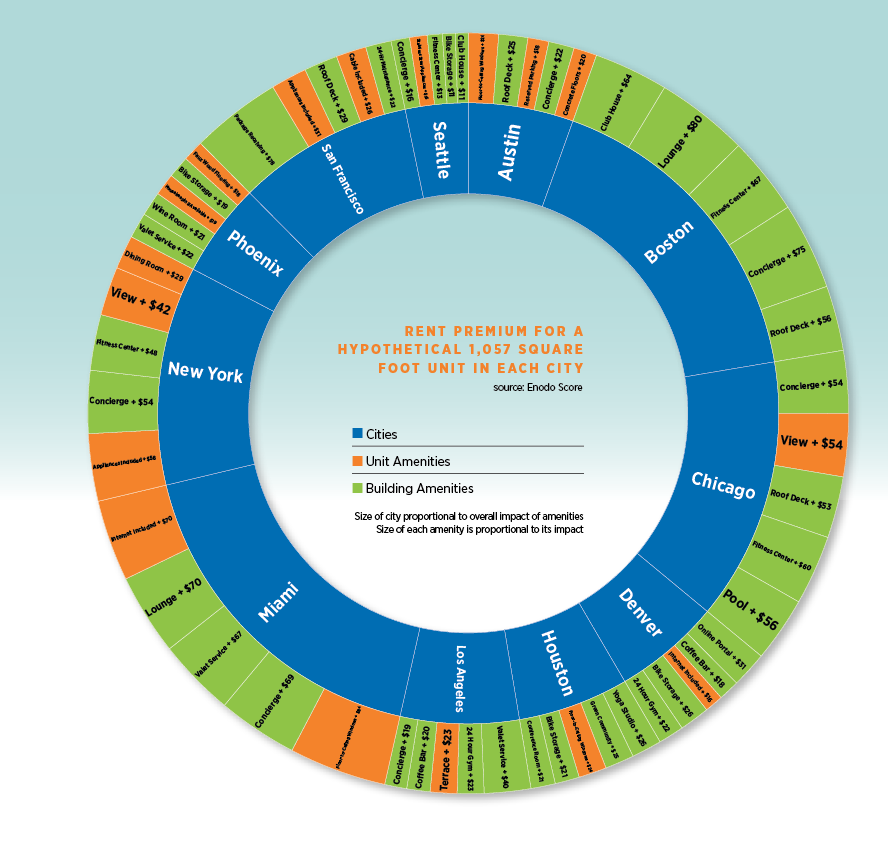
NAA thought Enodo Score’s insight would be particularly relevant to value-add investors, who rarely have an objective way to quantify the returns of various value-adds before installing them. The figure on the prior page highlights Enodo Score’s findings for 11 selected cities.
Some key take-aways from the city analysis include the notable differences in the popularity of amenities across different markets. What is most popular in one city may barely get noticed in another. For example, a fitness center commands different rent premiums in each market.
On a city-wide basis, building-level amenities tend to command higher rent premiums than unit-level amenities, which aligns with NAA’s research. Highly amenitized buildings tend to be in prime downtown areas, where rents are typically higher.
A concierge was most prevalent, ranking in the top 10 for rent premiums in nine of the 11 cities included in the study, with Boston commanding the highest premium of approximately $75 per unit per month. It also becomes apparent that amenities are valued far more in some markets, such as Boston and Miami with the highest rent premiums on average, over other markets like Seattle, Austin and Phoenix. Package delivery, which was found to add limited value at the national level in the NAA survey, rises to the top in the San Francisco market where very few properties currently offer it.
The Enodo Score data also reveals opportunities for owners to add a valuable amenity in a market that is not yet saturated with them, such as lounges in Miami or online portals in Denver. It truly highlights the local nature and nuances of real estate, not only down to the city, but to submarket and micro-market levels. The final section of the report takes a brief look beyond amenities into larger-scale renovations and rehabs.
Major Renovations
Data availability for larger-scale apartment property renovations or rehabs are far more robust than data for one-off amenity upgrades.
Across the U.S., Axiometrics counted more than 2,400 properties containing 654,000 units that underwent some type of renovation between 2014 and Q3 2016. More than 30 percent of the properties had rehabs that were significant enough to upgrade their classifications, as defined by Axiometrics.
Post-renovation effective rents averaged increases of 8 percent. Class C properties were able to push rents 11.8 percent, Class B, 7.6 percent and Class A, about 3 percent. Even so, a property with a pre-renovation classification of C that was upgraded to B averaged rents of $919 per unit after renovations, $880 less per month than their Class A counterparts. While owners of older properties can increase rents to help finance renovations that make their homes more competitive and attractive to residents, these properties are still able to maintain affordability, broadly speaking.
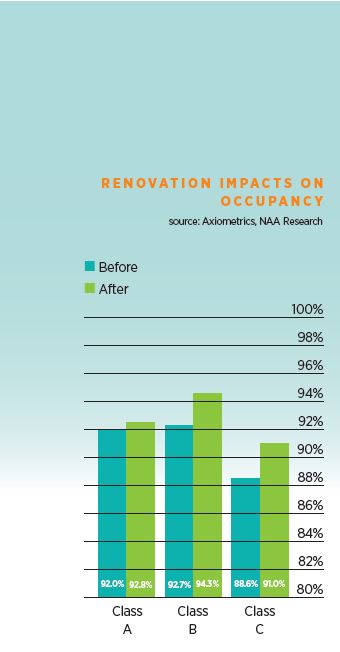
On average, occupancy rates in renovated properties increased by 0.55 percentage points in just three months, and an additional 1.15 percentage points six months after renovations were completed.
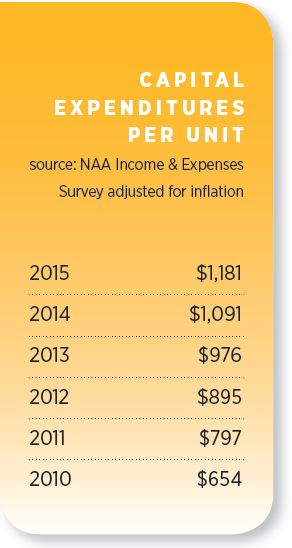
Data from NAA’s Annual Income & Expenses Survey show a steady run-up in capital expenditures since 2011, with owners spending approximately $1,200 on average per unit in 2015. For purposes of the survey, capital expenditures are defined as monies spent on items such as asphalt/parking, concrete, masonry, water heaters, range/cooktop/ovens, dishwashers, glass, blinds/draperies, sidewalks/curbing, vinyl, pool, new carpet, washers/dryers, club amenities, fitness equipment, etc. During the past five years, apartment owners have increased spending by an average of 13 percent annually, adjusted for inflation.
As the apartment market landscape becomes more competitive and new product comes on line, owners are reinvesting profits to keep their properties attractive to prospective residents.
Conclusion
Major renovations clearly have greater impacts on rents and occupancy levels, and the research provided in this report breaks this down further, focusing on the value of individual apartment amenities. While the extravagant ones make the news, there’s value to be gained in even the simplest of amenities such as washers and dryers in units, and providing pet-friendly environments.
The city-level analyses highlight the variance among cities in not only which amenities are already prevalent, but what’s considered valuable as measured by rent premiums. From an owner’s standpoint, having this knowledge before making costly and potentially risky investments is invaluable.
With more than 51 percent of all rental housing stock built before 1980 and new supply on the rise, it’s imperative that apartment property owners remain competitive, keeping buildings, outdoor spaces and individual residences up to date. Demographic and lifestyle trends that have favored apartment living in recent years show no signs of reversing themselves. Providing a wide range of amenity choices at all price points results in a win-win for both owners and residents.
Methodology, Sources & Acknowledgements
The Amenity survey was open to NAA members and non-members during the summer of 2016. Data was collected on more than 100,000 units in 35 states. Top 10 community and residence amenities were based on total number of units upgraded or added since Jan. 1, 2014. Average cost and rent increases were calculated for these units. Where data was more volatile, median calculations were used and are thus noted. Return on investment calculations for case studies used an average useful life of seven years, with the exception of full unit upgrades of 20 years.
Additional sources include: Endo Score, Axiometrics, J Turner Research and Yardi Matrix.
Visit Enodo Score to learn more. For information on NAA Research contact Paula Munger .