Following a year of moderate growth and solid fundamentals in 2018, the first six months of 2019 make that past year seem like a lull for the apartment industry. Concerns about overbuilding are continually met with reports of record-breaking absorption levels, decreasing vacancy and persistently strong rent growth. More investor dollars flowed into apartments than any other property sector with total transaction volumes up 9.6 percent year-over-year, according to Real Capital Analytics.
Measures of decline in total renter households from 2016 to 2018 vary widely by Census Bureau survey, ranging from a decrease of 110,000 households in 2018, according to the Housing Vacancy Survey (HVS), to 459,000 from the American Community Survey (ACS) in 2017, the most recent data available. ACS survey data showed that most of those declines occurred in single-family detached rentals. The two-quarters of data available this year from the HVS show homeownership rates trending downward after making significant upward movements in 2017 and 2018. Renter households are once again on the rise in 2019.
Trade tensions and slower global growth have rattled the nerves of investors, businesses and consumers. But job growth marches on, even though it comes at lower rates than 2018, and wage growth is even spiking in some metro areas, resulting in robust demand for apartments at all price points.
2019 Survey Results
The 2019 NAA Survey of Operating Income & Expenses in Rental Apartment Communities includes 2018 financial information for stabilized apartment communities with 50 or more units. The analysis in this Executive Summary refers to market rent, individually metered and recovery system properties, 87 percent of the survey responses (measured in units), unless otherwise noted. Figures are quoted on a per-unit basis. More information on the survey, methodology and terminology is included at the end of this summary.
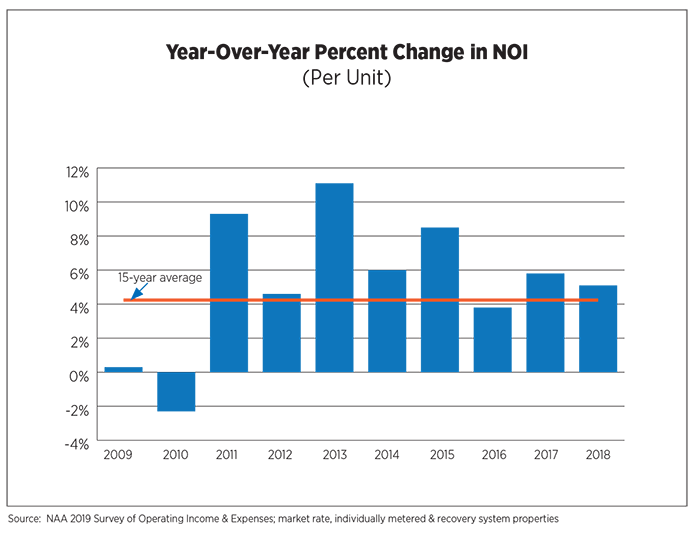
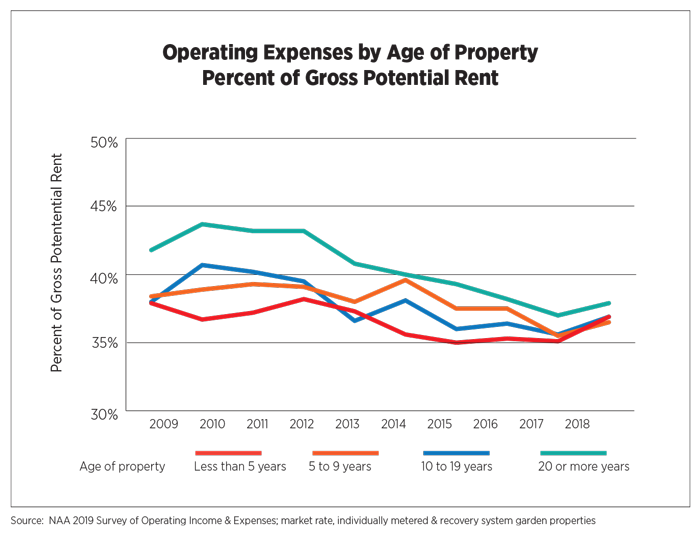
Net operating income (NOI) increased by 5.1 percent, a slightly slower pace than the prior year, but well above average. It was particularly impressive given that operating expenses swelled by 9.8 percent, its highest year-over-year increase during this cycle.
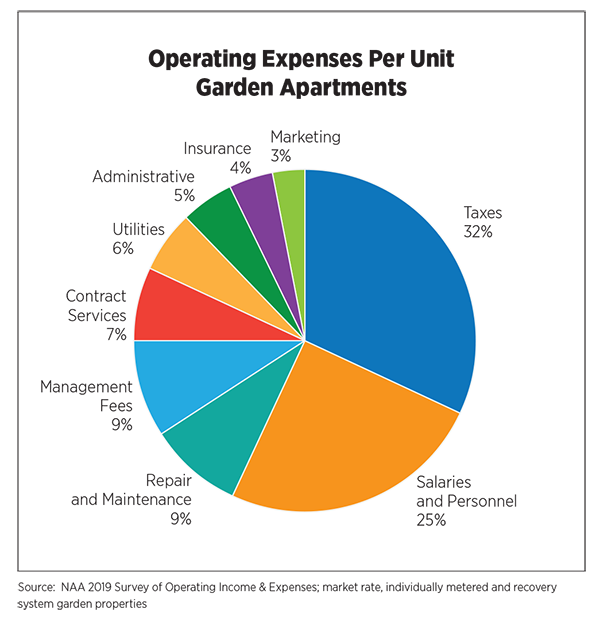
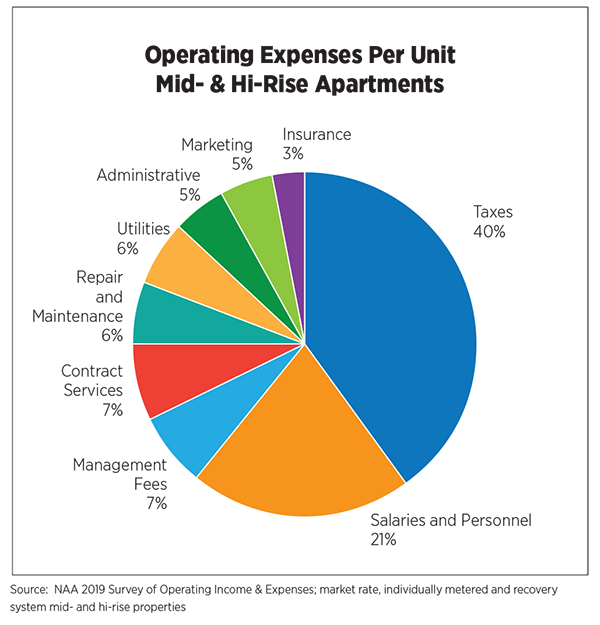
Property taxes have nearly doubled during the past 10 years, posting an increase in excess of 10 percent in 2018, and now average $2,030 per unit. Marketing expenses and contract services (landscaping, pest control, security, etc.) also experienced double-digit growth, not unexpected given that average annual rates of inflation and wage growth were at their highest levels since 2011 and 2008, respectively.
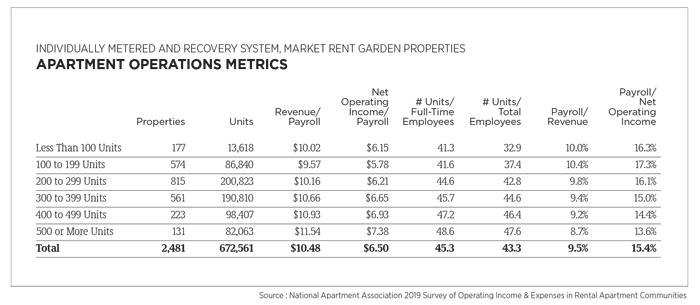
Tight labor market conditions and low unemployment rates revealed themselves in the salaries and personnel-expense line item, which increased by 5.8 percent, the highest jump since 2004. The number of units per full-time employee also reached a high of 45.3. While this could be viewed as an increase in productivity, it likely is more indicative of a labor shortage as talent acquisition and retention remained top concerns for owners and operators.
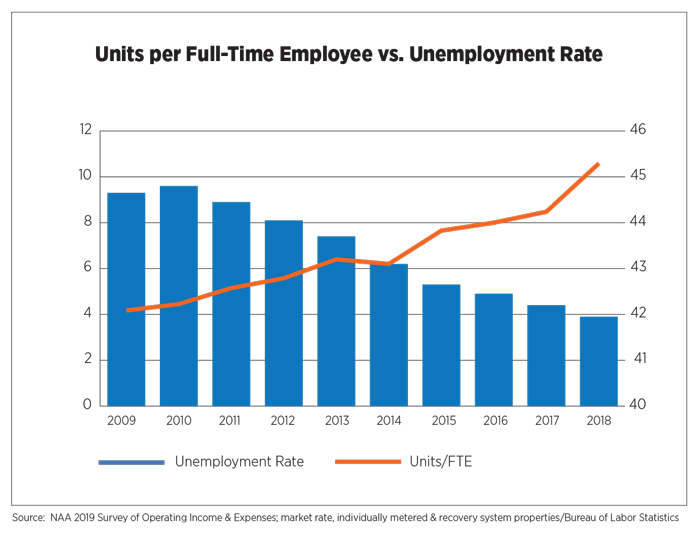
“Floating” and “roving” are often listed in job descriptions, particularly for property managers and maintenance technicians who are stretched by longer and more challenging recruiting periods for other vacant positions. According to CEL & Associates, turnover rates in the apartment industry increased in 2018 for all job titles. That trend is showing signs of reversing this year except for onsite maintenance personnel, with projected turnover rates expected to hit a decade-high of 39.2 percent.
Capital expenditures dipped below 10 percent of Gross Potential Rent (GPR) for the first time in three years but remained above the long-term average of 8.7 percent. High levels of demand in this competitive landscape kept owners and operators busy with property and unit upgrades, renovations and improvements.
Total revenue was up 6.8 percent in 2018. Economic losses, which measure the difference between GPR and actual rent collected, have remained in the 7 percent to 8 percent range for the past five years, a testament to strong demand, steady rates of absorption and improving income levels of residents. Prior to the recession and in the early years of recovery, economic losses averaging more than 10 percent were not unusual. Revenue lost to collections or “bad debt” hit its lowest level since at least 2000, when the data were first collected, measuring just one-half of one percent of GPR. Losses to vacancy declined slightly this year (5.9 percent of GPR) and losses to concessions leveled off at 1.1 percent.
Ancillary revenue remained essentially unchanged, accounting for 5.9 percent of total revenue. Of the other revenue types identified in the survey, the largest increase was in parking fees, which also provided the greatest source of other revenue, followed by amenities fees and pet fees.
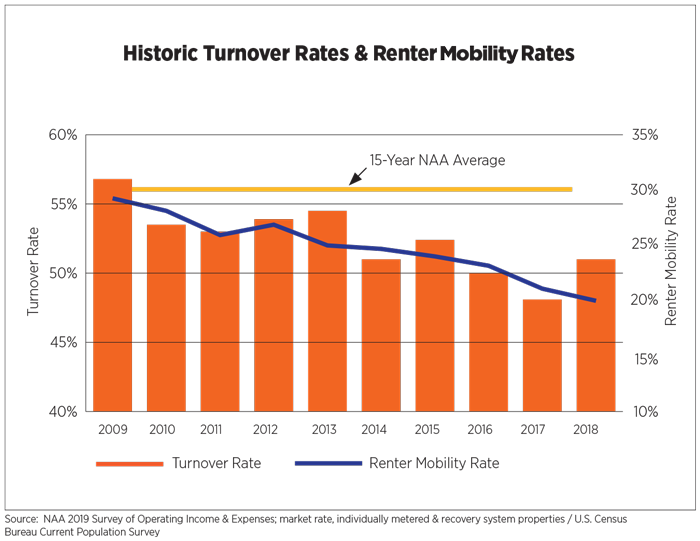
The apartment turnover rate increased after experiencing significant declines for the past two years. The average turnover among our survey respondents was 51 percent, up from 48 percent (revised figure) in 2017. Although the NAA turnover rate was closely tracking with the U.S. Census renter mobility rate, it’s important to note that the Census includes all rental housing types while NAA’s covers mostly garden-style, market-rate apartments with 50 or more units. A plethora of rental options, transitions to homeownership and increased buying power meant more residents were on the move.
Metropolitan Area Overview
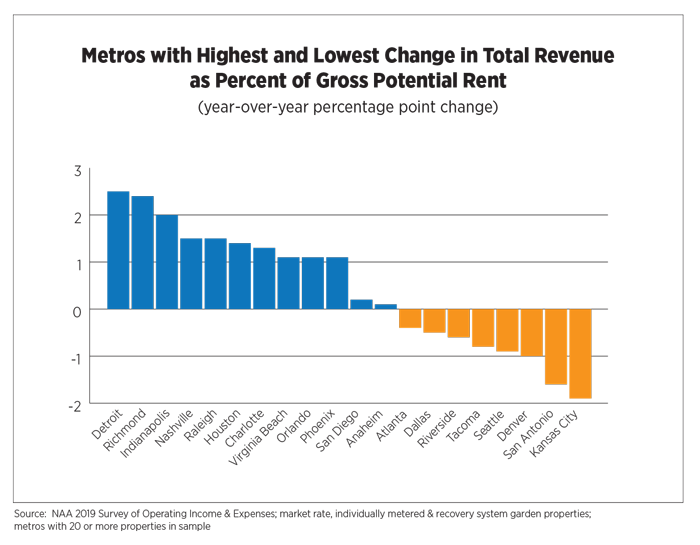
The full report includes income and expenses statistics on market-rate apartment communities for 80 metropolitan areas. This metro area analysis focuses on year-over-year trends for operating expenses, total revenue, additional revenue and net operating income for garden-style, individually metered and recovery system properties in metro areas that had 20 or more properties in the sample. Figures are expressed as a percent of GPR unless otherwise noted. The top 10 metros for largest increases and the largest decreases in revenue and operating expenses are displayed in charts that follow.
Total revenue per unit ranged from $9,741 in Greensboro to $21,851 in San Diego. Detroit experienced a 2.5 percentage point increase in total revenue, most of which was due to other revenue sources since rent revenue only increased marginally. Kansas City placed at the bottom of the list, falling 1.9 percentage points. In addition to rent revenue and ancillary revenue decreasing, losses to concessions had a higher negative impact there.
Parking was the highest source of additional revenue in the Pacific Northwest markets of Seattle, Portland and Tacoma as well as in Denver and Indianapolis. However, the Riverside and Austin markets saw a 0.2 percentage point decline from 2017 to 2018. Amenities fees were a prevalent additional source of revenue in eastern and southern markets. Washington, D.C., Nashville and Orlando each saw 0.4 percentage point increases.
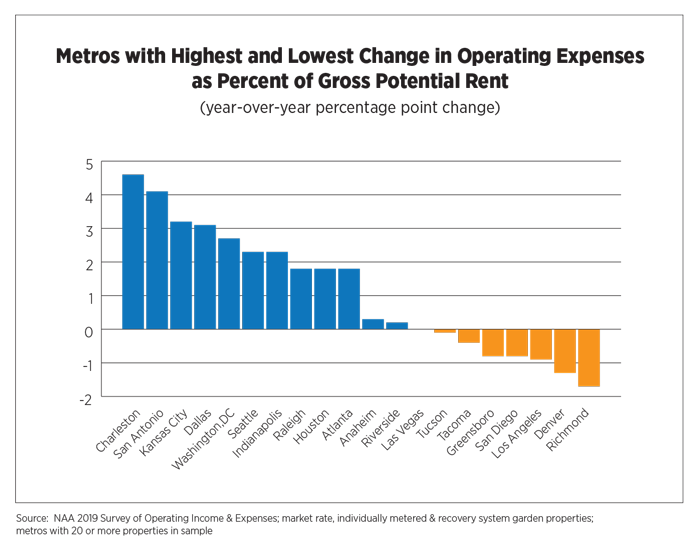
NOI varied from $15,424 in San Diego to $5,433 in San Antonio. Richmond saw the highest NOI growth, experiencing a 4.0 percentage point increase. Richmond’s solid bottom line is attributed to a favorable decline in operating expenses by 1.7 percentage points along with a complementary increase in revenue by 2.4 percentage points. A combination of increased rent revenue and fewer losses to vacancy were the main drivers.
Operating Expenses ranged from $4,068 per unit in Las Vegas to $7,385 in Los Angeles. Richmond experienced the largest decrease, mainly driven by a decline in salary and personnel costs of 1.4 percentage points. Charleston led in operating expenses growth with a 4.6 percentage point change due to increases in management fees, taxes and contract services.
Outlook
With half of the year behind us, 2019 is shaping up to be a better-than-average year for apartments and should outperform 2018 by most measures. Yardi Matrix is forecasting completions in the 300,000-unit range in 2019 and counts 600,000 units currently under construction. Construction delays due mainly to labor shortages will likely spread out some of those deliveries beyond 2020. Census reports show multifamily permits slowing during the past few months with June’s seasonally adjusted annual rate of 363,000 units at its lowest level in more than three years, suggesting a slowdown in new supply in the early part of the next decade.
Talent sourcing, new and disruptive technologies and preparing for Gen Z will remain top of mind for apartment owners and operators in 2020. Affordability issues in many areas across the nation show no signs of easing. While incomes have been on the rise, stronger and more prolonged improvements will be necessary to erase years of stagnation. Coupled with increased costs for the industry – for land, construction, new development and operations – affordability constraints will persist. Against a backdrop of economic uncertainty and a potential slowdown, more urgency should be given to building new revenue streams.
On the plus side, demand fundamentals, which have driven apartment market growth thus far, remain firmly in place. Renting remains a more affordable choice in many markets across the country and fits the lifestyle preferences, along with the amenity, convenience and community needs of an increasingly diverse resident base.
About the Survey
The survey was conducted, compiled and tabulated by CEL & Associates, Inc. Special thanks to Janet Gora, Managing Director, CEL & Associates, Inc. A total of 3,698 properties containing 940,966 units are represented in this year’s report covering financials from 2018.
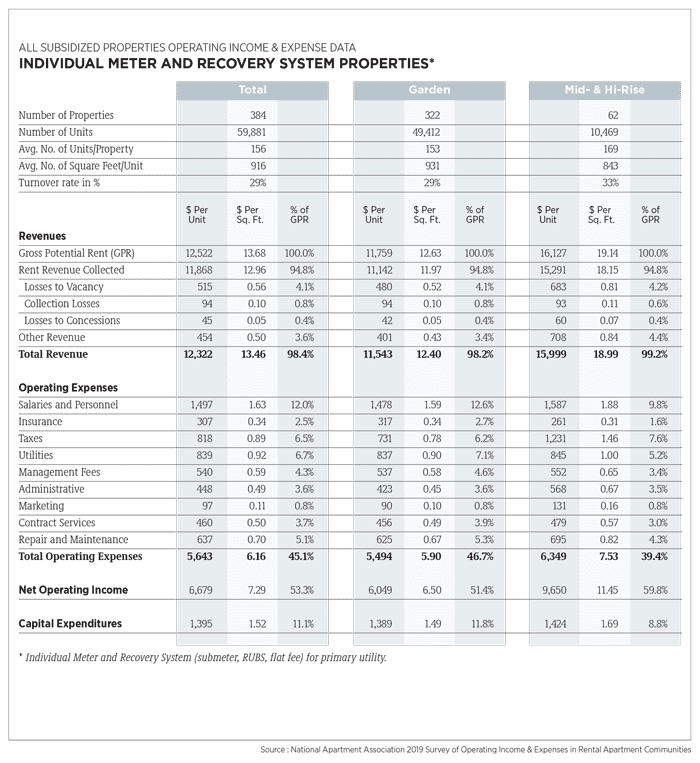
Data were reported for 3,205 market-rent properties containing 864,330 units and 493 subsidized properties containing 76,636 units. (Surveys with partial data or apparent problems that could not be resolved were not included.)
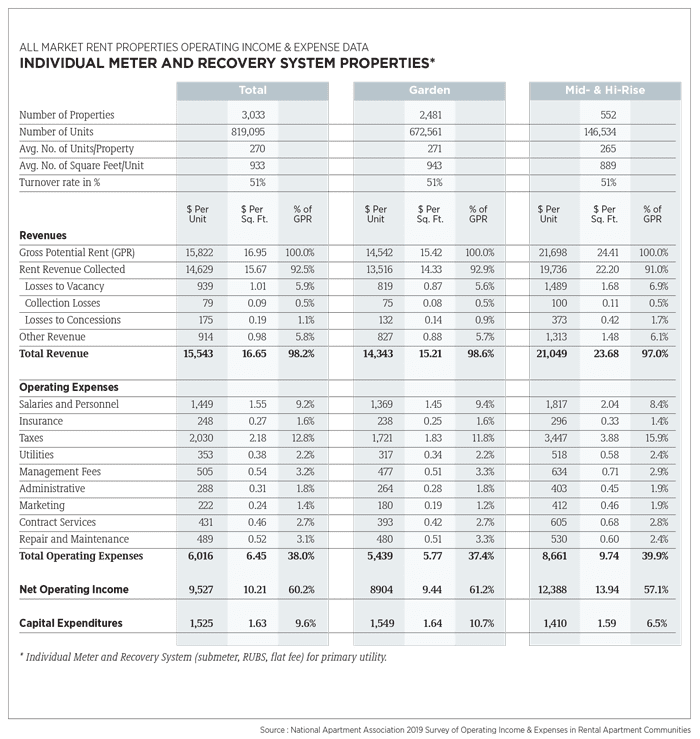
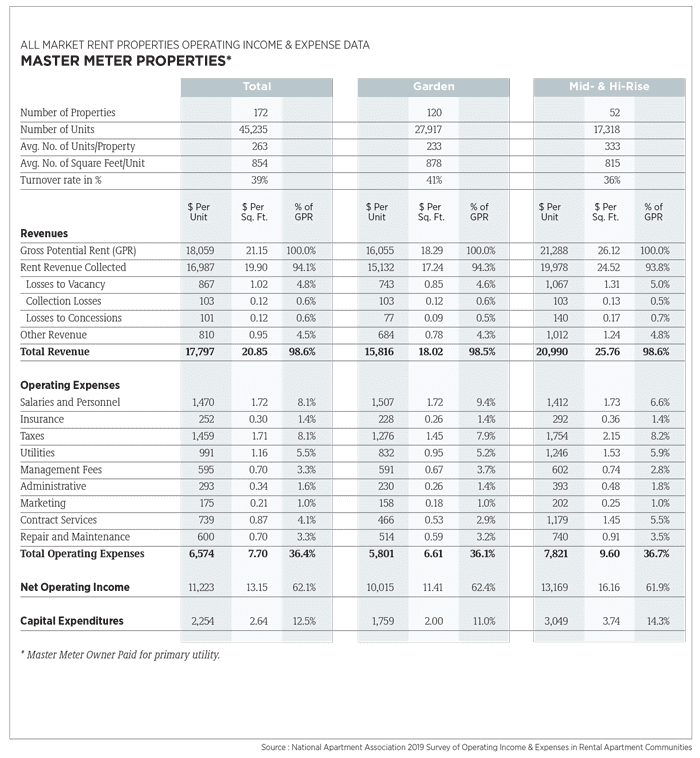
The report presents data from stratifications of garden and mid-rise/high-rise properties; it is further segmented by individual meter and recovery systems (e.g., submeter, RUBS, flat fee) and master-metered utilities, for the property’s primary utility. Survey data is presented in three forms: Dollars per unit, dollars per square foot of rentable area and as a percentage of GPR. Responses from garden properties with individual meter/recovery utilities represent 78 percent of the market-rent units and 64 percent of the subsidized units. References to statistics within the analysis typically refer to total market-rate, individual meter and recovery system properties, except where noted as garden style or mid- and high-rise.
The market-rent segment generally has more units per property and greater floor area per unit than the subsidized segment. The average size (number of units) of individual meter/recovery, market-rent properties is 270 units in 2018 (272 in 2017) and 156 units in subsidized properties in 2018 (165 in 2017). Rentable floor area averaged 933 square feet (934 in 2017) for market-rent apartments and 916 square feet (924 in 2017) for the subsidized units.
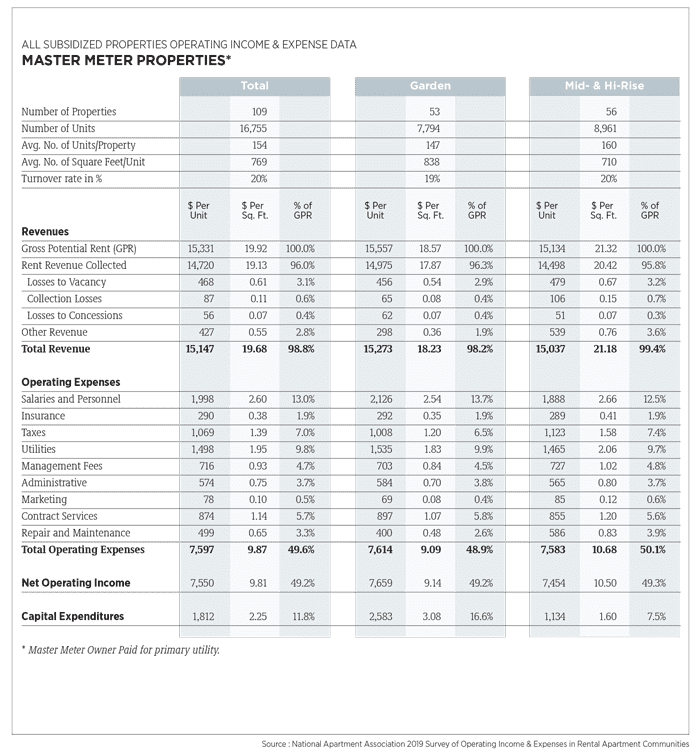
The full report contains detailed data summarized for NAA’s 10 geographic regions, and 80 metropolitan areas met the separate reporting criteria for market-rent properties. Sufficient numbers of subsidized properties were submitted for 17 metropolitan areas.
This report also includes results for all “other” properties at the state level located in metro areas that did not meet criteria for separate reporting. Non-metro area reporting also is included at the state level. Tables for these “other” market-rent properties are provided for 17 states and for subsidized properties in 14 states. The NAA survey includes standard utilities and distinguishes expenses and recoveries by utility configuration to confirm that net utilities are reported. This level of standard utility expense more consistently represents utilities for comparison between properties. Not all properties are able to designate this detail. The additional utility-reports represent those properties that offer utility detail for comparison. Additional reporting for the expanded segmentation areas represents those properties that reported detail. Those that did not were reported as “other.”
Glossary of Terms
Administrative. Total monies spent on general and administrative items such as answering service, donations, mileage reimbursement, bank charges, legal/eviction charges, postage, telephone/fax/internet charges, office supplies, uniforms, credit reports, permits, membership dues, subscriptions, data processing, etc. Does not include any payroll-related expenses.
Capital Expenditures. Capital Expenditures are separated by the categories listed (renovations, replacements and “other”). All “other” CapEx expenses would include the sum of any items not specifically listed above. A zero on the line meant there were no capital expenditures.
Contract Services. Contract Services are separated by the categories listed (landscaping, pest control, security and “other”). All “other” contract services expenses would include the sum of any items not specifically listed above (e.g. Snow removal, and other services provided on a contract basis). Trash removal is not included here.
Gross Potential Revenue/Rent Residential. Total rents of all occupied units at 2018 lease rates and all vacant units at 2018 market rents (or fiscal year end).
Heating/Cooling Fuel. Type of fuel used in apartment units.
Insurance. Includes property hazard and liability and real property insurance and does not include health/payroll insurance.
Maintenance. Total monies spent on general maintenance, maintenance supplies and uniforms, minor painting/carpeting repairs, plumbing supplies and repairs, security gate repairs, keys/locks, minor roof/window repairs, HVAC repairs, cleaning supplies, etc. Does not include any payroll related expenses or non-recurring capital expenses. Contract services are reported separately.
Management Fees. Total fees paid to the management agent/company by the owner.
Marketing. Marketing expenses are separated by the categories listed (internet, print, resident relations and “other”). All “other” marketing expenses would include the sum of any items not specifically listed above. (e.g. locator fees, signage, model expense, etc.) NOTE: rent concessions are not included.
Net Commercial Square Footage. Total rentable square feet of commercial floor space.
Net Rentable Residential Square Feet. Total rentable square feet of floor space in residential units only. Area reported includes only finished space inside four perimeter walls of each unit. Common areas are excluded.
Other Revenue. Monies received are separated by the categories listed (amenity fees, laundry, parking, pet fees, storage and “other”). All “other” would include the sum of any items not specifically listed above. (e.g. vending, deposit forfeitures, furniture, late fees, termination fees, application fees, etc.) NOTE: interest income or utility reimbursements are not included. (Utility reimbursement/recovery is subtracted from gross utility costs.)
Payroll Costs. Gross salaries and wages paid to employees assigned to the property in all departments. Includes payroll taxes, group health/life/disability insurance, 401(k), bonuses, leasing commissions, value of employee apartment allowance, workers’ compensation, retirement contributions, overtime and other cash benefits.
Rent-Controlled Property. A property is subject to rent controls through local or state government regulations. This does not apply if rents are controlled through a government program that provides direct subsidies.
Rental Revenue Commercial. Total rent collections for commercial space after vacancy/administrative, bad debt and discount or
concession losses.
Rental Revenue Residential. Total rent collections for residential units after vacancy/administrative, bad debt and discount or concession losses.
Revenue Losses to Bad Debt/Collections. Amount of residential rents not received due to bad debt/collection losses.
Revenue Losses to Concessions. Amount of gross potential residential rents not received due to concessions.
Revenue Losses to Vacancies. Amount of rental income for residential units not collected because of vacancies and other use of units, such as models and offices.
Subsidized Property. A property has controlled rents through a government subsidized program (low-income housing).
Taxes. Total real estate and personal property taxes only. Does not include payroll or rendering fees related to property taxes or income taxes.
Tax-Exempt Bond or Housing-Credit Property. A property that has received tax-exempt bond financing and/or is a low-income tax credit property.
Total Operating Expenses. Sum of all operating costs. The sum of all expense categories must balance with this line, using total net utility expenses only. Does not include debt service or any one-time extraordinary costs.
Turnover. Number of apartment units in which residents moved out of the property during the 12-month reporting period.
Utilities. Total cost of all standard utilities and each listed type, net of any income reimbursements from residents (e.g. submeter, RUBS, flat fee or similar system).
Utility Configuration. Whether electric, gas, oil and water/sewer utilities to individual units in subject property are: Master Metered, Owner Paid; Master Metered with a Resident Recovery System, (submeter, RUBS, flat fee); Individual Meter, Resident Paid. Report grouping is based on the configuration of the primary utility for the residents.
Thank you to Our Participating Companies
A special note of appreciation from NAA to the 157 firms who donated their time to accumulate the data necessary to make this survey valuable. The following companies and their officers provided 20 or more properties for the 2019 Survey of Operating Income & Expenses in Rental Apartment Communities.
