Barriers Rankings #51: Baltimore, MD
 New MF Demand: 17.7k
High Rent Burden: 44%
Star Share: 31%
Median Rental: $44,790 Household Income
Income Required: $50,800 Average Rent
Most Restrictive Apartment Categories:
- Approval Timeline
- Land Availability
- Infrastructure Constraints
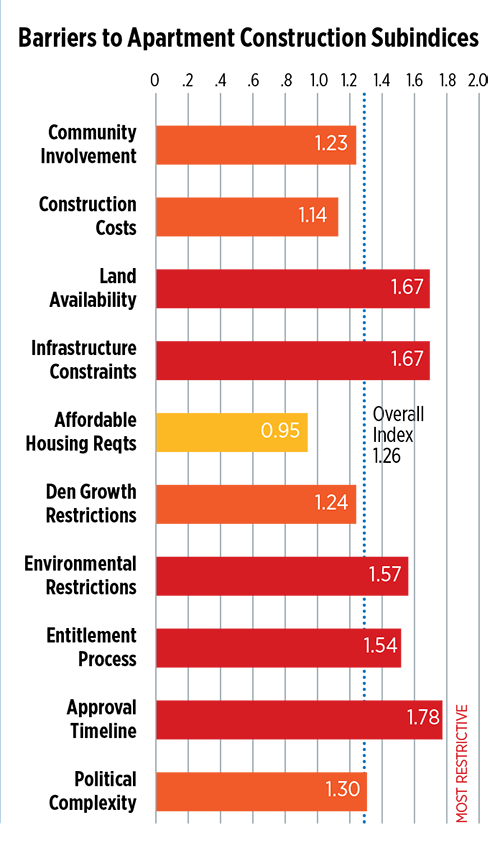
Baltimore ranks highly restricted in the bottom fourth amid softer demand when measured against other major markets. Survey respondents cite an array of barriers that shadowed the typical barriers of cost, community opposition and politics with a higher 1.26 overall index. Land availability is expectedly restrictive, along with infrastructure constraints seen in both availability and school crowding. Environmental issues center on coastal restrictions, wetlands and mitigation. Entitlement process issues include a range of council opposition, historic district and design criteria unknowns. Yet most restrictive is the typical timelines for rezoning and discretionary use permits. Metro rental incomes trend 12% below the requirement for average market rents of $1,270. City Council has recently passed an affordable housing trust fund using future transfer taxes with a source of income provision expected in March 2019.
Barriers Rankings #52: Washington, DC
 New MF Demand: 106k
High Rent Burden: 41%
Star Share: 19%
Median Rental: $63,870 Household Income
Income Required: $68,000 Average Rent
Most Restrictive Apartment Categories:
- Infrastructure Constraints
- Construction Costs
- Land Availability
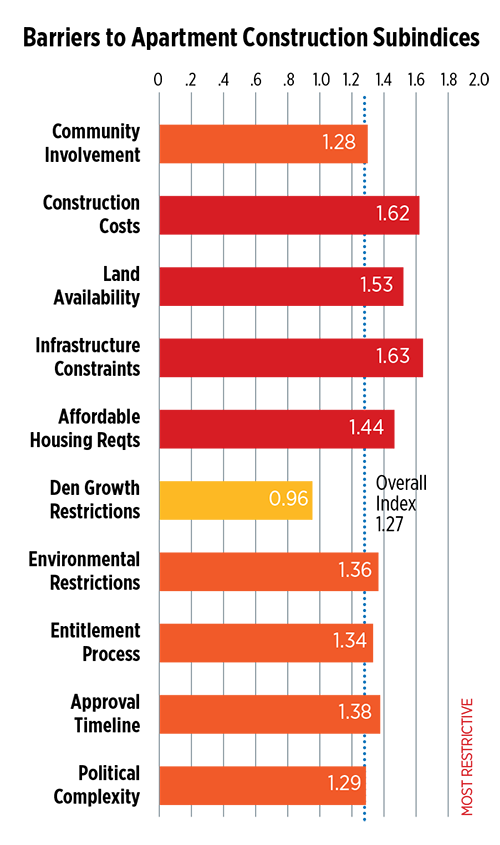
Washington is experiencing a boom with sustained demand for new multifamily in the top third of national metro, yet ranks near the bottom of major markets for barriers to new apartment development with an overall index of 1.27, similar to Baltimore and New York. Local respondents cite four subindices as most restrictive. Construction costs are higher, land as a driver, while land supply itself is highly restrictive. Infrastructure constraints are driven by traffic and school crowding. Affordable housing requirements are heavy with few mitigation policies. Political complexity and regulation combine to raise the next four subindices seen in the third quartile. Density and growth restrictions is deemed relatively lower. Median metro rental income ranks second of the major markets behind San Francisco, though this spending power is much better aligned and only 6.0% below the income requirement for average market rents of $1,700.
Barriers Rankings #53: San Diego, CA
 New MF Demand: 60.3k
High Rent Burden: 49%
Star Share: 58%
Median Rental: $54,300 Household Income
Income Required: $73,520 Average Rent
Most Restrictive Apartment Categories:
- Land Availability
- Environmental Restrictions
- Community Involvement
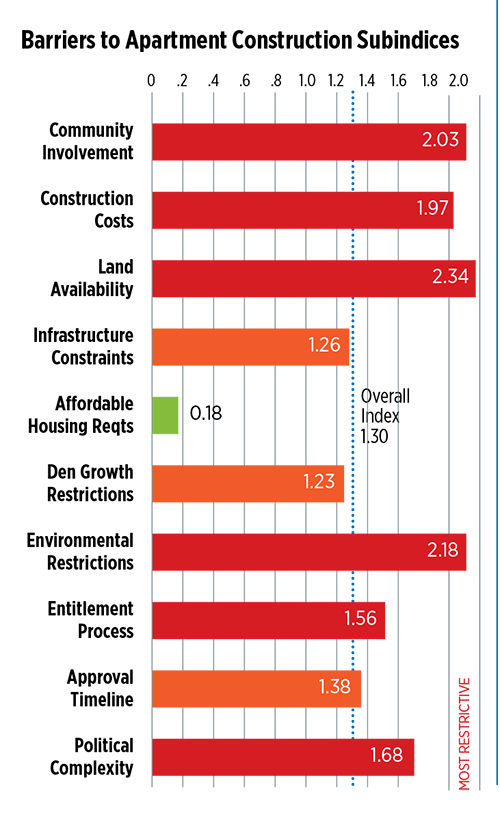
San Diego was one of four pilot metro markets explored with an earlier survey and is recast below with updated indexing. A highly desirable, land-constrained market, San Diego metro has multiple factors ranked high for their impact on apartment development. Respondents particularly noted that citizen opposition to growth influences the development process through an array of advocacy groups, public votes to circumvent council or planning commissions, repeated lawsuits, and numerous community meetings required before zoning or rezoning. Construction costs are driven up by the high number of impact fees, lack of waivers or processes to mediate fees, and high and increasing land costs. In addition to coastal restrictions, environmental restrictions and mitigation, the area ranks high in the number of conservation bonds passed at the local and state level in the past ten years including the California Environmental Quality Act (CEQA). Metro experts also noted process and political structure issues that create uncertainty and delays in the entitlement process. Complex approval structures requiring multiple submissions to approve developments are frequently cited.
Barriers Rankings #55: San Francisco, CA
 New MF Demand: 59k
High Rent Burden: 41%
Star Share: 54%
Median Rental: $73,310 Household Income
Income Required: $104,040 Average Rent
Most Restrictive Apartment Categories:
- Construction Costs
- Land Availability
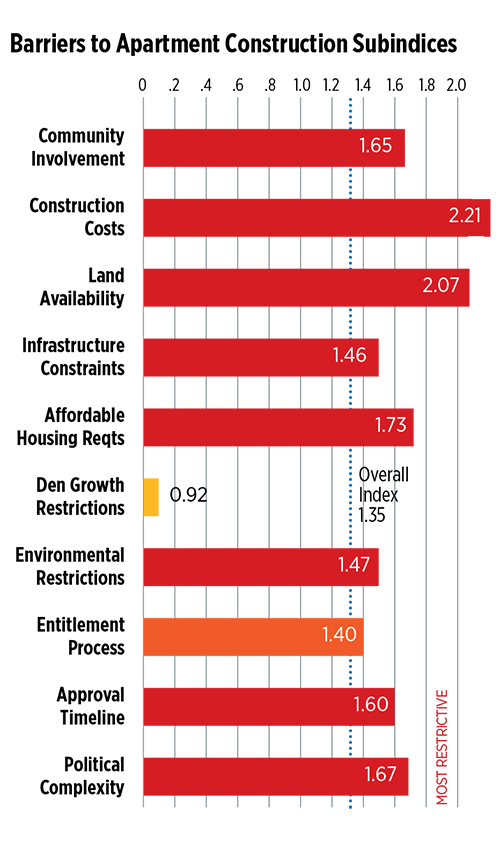
Metro San Francisco, true to reputation, ranked near the bottom as most restrictive new apartment market surveyed with an overall index of 1.35. Local respondents provide scores in the top quartile for all but two subindices. Most restrictive is construction costs, including land and recent increases, followed by land availability and its feasibility for development. Community involvement is driven by strong local opposition and lengthy public meetings. Affordable housing requirements are considered heavy. Long approval timelines for rezoning are fueled by strong local and State influences, often requiring a third-party development advocate. Though the metro enjoys the highest median rental incomes of the major markets, these incomes remain a significant 30% below the requirement for average market rents of $2,850 while 41% of renters are paying over 35% of incomes on their lease.
Barriers Rankings #57: Philadelphia, PA
 New MF Demand: 29.5k
High Rent Burden: 49%
Star Share: 37%
Median Rental: $36,400 Household Income
Income Required: $49,680 Average Rent
Most Restrictive Apartment Categories:
- Environmental Restrictions
- Infrastructure Constraints
- Approval Timeline
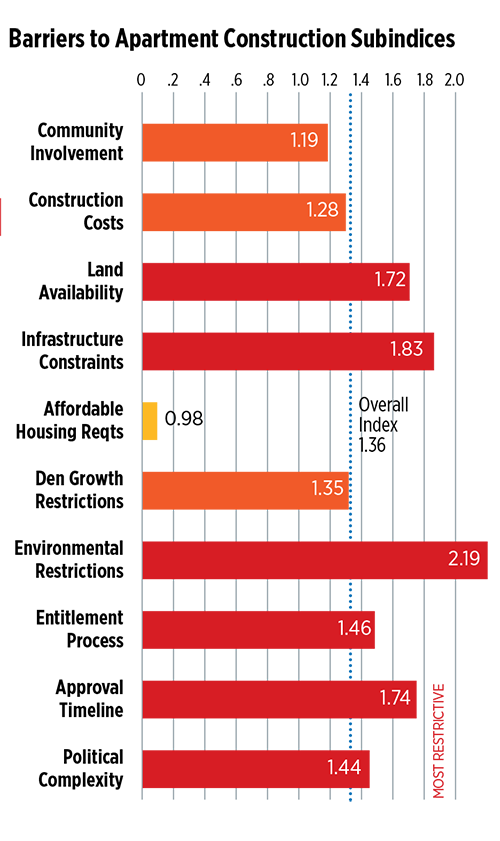
Philadelphia metro ranks in the bottom third of national apartment demand and near bottom for barriers to development with a supply index of 1.36. Only San Jose ranks a more restrictive major market. Survey respondents cite environmental restrictions highest, driven by coastal and wetland issues, flood zone restrictions and their mitigation. Infrastructure constraints led by impact fees are also cited, along with general land availability and lengthy approval timelines. Political complexity is led by the heavy influence of both local councils and their public constituents. Legislation and tax increases need assessment of their housing impact ahead. Other research cites that housing affordability is less about rents and more tied to lower worker incomes; the median rental income ranked in the lower third of major markets and is a significant 27% below the requirement for the average market rents of $1,245. As with scaled metros like Philadelphia, these barriers become more pronounced in the urban core relative to outlying housing sectors.
View The Market Most Resistant To Development
View and Download the Full Report
Definitions and Notes
- BARRIERS RANKING is the relative ranking among 58 major metro apartment markets based on the average index of each metro from the least restricted to the most; ranges from 1 (Albuquerque) to 58 (San Jose). Rankings consider expert responses from throughout the extended metro that includes but not isolates the urban core.
- NEW MF DEMAND is the updated total demand for new multifamily units (in thousands) through 2030 based upon the forecasted total rental housing demand 2017-2030 from the NAA-NMHC demand study by HAS: U.S. Apartment Demand—A Forward Look (2017); ranges from 3,890 (Sioux Falls) to 222,589 (New York).
- HIGH RENT BURDEN refers to that share of 2017 households spending over 35% of combined household income on rent; major metro ranges from 56% and rents of $1,370 (Miami) to 38% and rents of $865 (Sioux Falls) with a major metro average of 43%.
- STAR SHARE is that share of metro rental housing stock with five or more units HAS qualified as Second-Tier Affordable Rentals or those non-institutional sites of typically lower unit count, lower quality and greater age, often overlooked as crucial affordable housing already in place. Using CoStar® ratings of 1-5 for sites of five units or more,
- STAR is the lower ratings of 1-2. This share ranges from 61% (Los Angeles) to 17% (Austin) with a major metro average of 36%.
- INCOME REQUIRED FOR AVERAGE RENT assumes a more conservative 30% of rental household income needed for the average metro contract rent.
