
As the following charts and tables illustrate, capital expenditures (Cap Ex) is a key metric in rental housing. Based on recent and historical information from NAA's Survey of Operating Income & Expenses, as well as data from CoStar, Yardi, the Joint Center for Housing Studies of Harvard University and several federal agencies, including the U.S. Census Bureau, read on to discover how these costs are affecting regions, property types and property sizes.
Historical Capital Expenses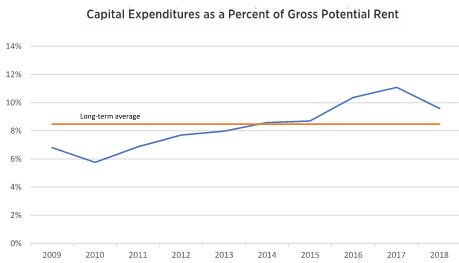
- After a 7-year ramp-up, capital expenditures declined in 2018, but exceeded the long-term value.
- Competitive markets driven by new construction and amenities wars.
Capital Expenditures by Age of Property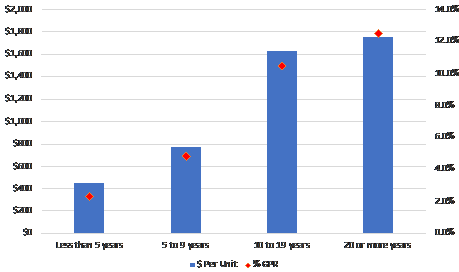
- As a percent of Gross Potential Rent (GPR), older properties' outlays on improvements are more than five times greater than new construction.
Capital Expenditures by Size of Property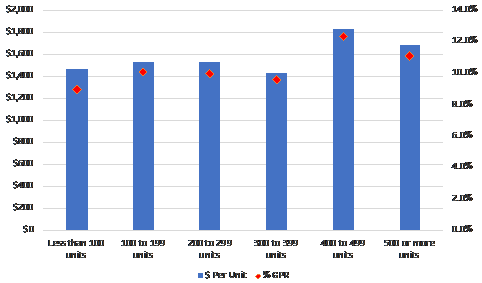
- Less variation in expenditures by property size.
- Properties with 400 or more units have the highest Cap Ex by both measures.
Capital Expenditures Percent of GPR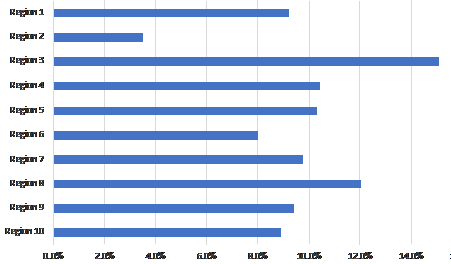
- Region 2 - small sample size.
- Region 3 - 70 percent garden-style properties, typically higher Cap Ex.
NAA Regional Map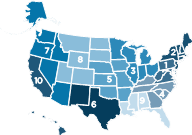
Note: Arkansas, currently in Region 5, was included in Region 6 in this data.
Profile of Properties Under Renovation (November 2019)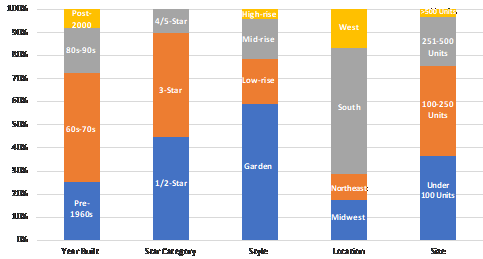
- Total properties under renovation: 563
- 97,500 units
Adaptive Reuse Projects
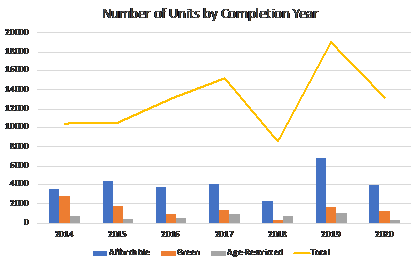
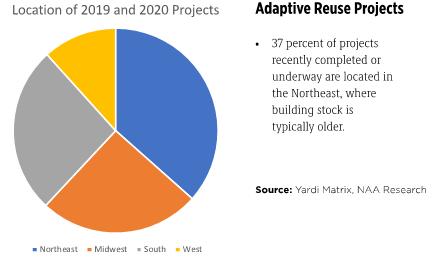
- More than 32,000 adaptive reuse units completed or scheduled for completion in 2019 and 2020 in the U.S.
- Affordable (partial and full) and "green" projects are most common.
Rental vs. Owner Improvements and Maintenance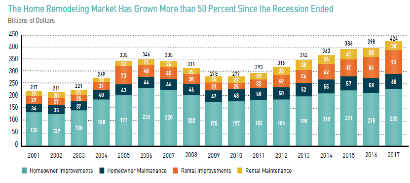
- Rental housing improvements nearly tripled since the end of the recession and totaled $93B in 2017.
Order the complete 2019 NAA Income & Expenses Survey here.