Key Takeaways from the 2017 NAA Survey of Income & Expenses
The inclusion of student housing information was a new addition to the 2017 NAA Survey of Operating Income and Expenses in Rental Apartment Communities (IES). Income and expenses data were collected for 44,070 beds. Although a much smaller sample than the 980,030 market-rent units included in the survey, high-level comparisons yielded some interesting insights.
Revenues
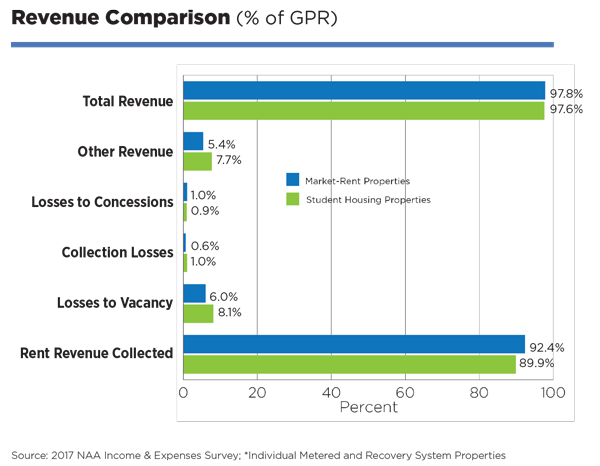
- Rent Revenue Collected for student housing is a smaller share of Gross Potential Rent (GPR) at 89.9 percent compared to conventional apartments at 92.4 percent. Student housing has higher Losses to Vacancy at 8.1 percent compared to 6.0 percent, reflecting both the unique seasonality around the school year, as well as excess new supply in some markets.
- Nevertheless, student housing almost makes up for the difference with higher Other Revenue (especially in the Amenity Fees and Other categories) making up 7.7 percent of GPR, compared to 5.4 percent of GPR for conventional apartments. As this sector has evolved in recent years, students and their parents are seeking amenities equal to, and sometimes better than, conventional counterparts.
- Total Revenue for Student Housing stands at 97.6 percent of GPR, in line with conventional apartments.

Operating Expenses
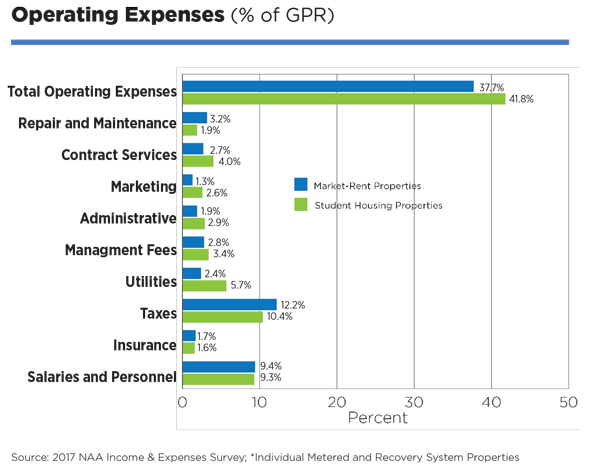
- Student Housing has higher Total Operating Expenses at 41.8 percent of GPR, compared to 37.7 percent for conventional apartments. While taxes are a lower percentage of GPR for those properties in the sample, utilities, management fees, administrative costs, marketing and contract services eat into a higher share of revenues for student housing.
- Consequently, NOI is higher for conventional apartments at 60.1 percent of GPR, versus 55.8 percent for student housing.
- Capital expenditures for student housing are significantly lower than conventional apartments at 4.4 percent versus 10.4 percent. This may be a factor of age, with student housing’s relatively recent surge in popularity among investors and developers.
- Utilities and marketing stand out as comprising significantly higher percentages of costs in student housing vs, conventional. Marketing expenses are 2.6 percent of GPR, double that of conventional apartments, with a greater share in the sub-category of “resident relations” to include special events.

Note: Figures are presented as percentages due to bed vs. unit reporting differences.
To order the current Income & Expense Survey or to participate in this annual survey this spring, please contact Paula Munger. Participants receive a free survey upon its completion.
