
U.S. Apartment Market
The U.S. multifamily market remained on its course of modest growth in Q1, with favorable vacancy rates and rent growth. The effects of COVID-19 were not yet reflected in the data, however the pandemic’s impact on apartment fundamentals are anticipated to show in Q2 2020.
The apartment sector continued to indicate stability as occupancy rates averaged 95.5 percent during the first quarter, up by 0.7 percentage points since Q1 2019, as reported by RealPage. Markets that saw the greatest decrease in vacancy year-over-year included Dayton, Pittsburgh, Wichita, Nashville, and St. Louis, according to REIS. Nashville was among the top metros for largest over-the-year percentage growth in employment, up 8.2 percent based on data released by the Bureau of Labor Statistics. Greenville, Columbia, Fort Lauderdale, Charlotte, and Greensboro posted the leading increases in vacancy.
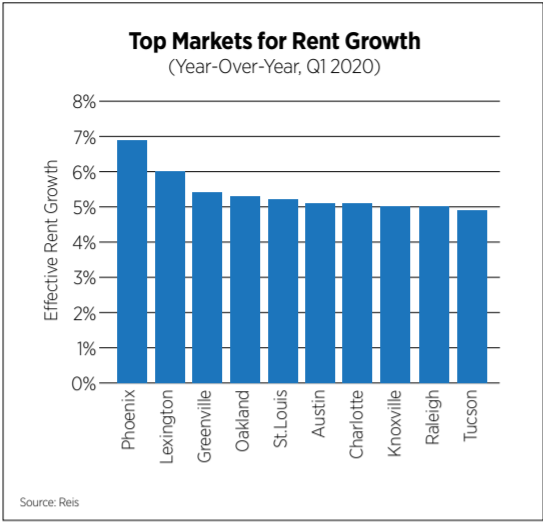
The national effective rent averaged $1,427, increasing 0.7 percent since the previous quarter and 4.0 percent since Q1 2019. Phoenix, Lexington, Greenville, and Oakland-East Bay led the U.S in asking and effective rent growth year-over-year.
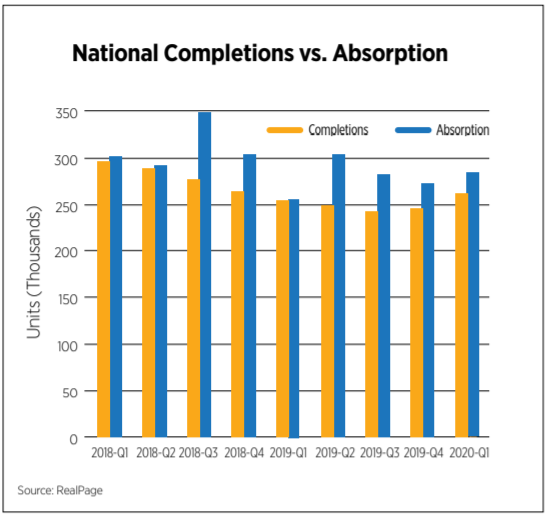
The multifamily sector added 263,209 units to the market in Q1, the highest level of deliveries during the first quarter since Q1 2018. Interruptions due to COVID-19 are expected to cause many multifamily construction projects to pause due to shortage of labor and supplies as well as government intervention in some areas. As demand for apartments stood strong, the market absorbed 284,025 units, making it the ninth consecutive quarter that absorption outpaced deliveries. Demand could slow during this year’s leasing season due to rising unemployment rates and shelter-in-place orders.
The seasonally adjusted annual rate for multifamily building permits in March totaled 423,000 units, decreasing by 3.6 percent since March 2019, according to estimates by Census. The top-ranking markets for number of permits issued in March included Houston (2,638), New York City (2,087), Los Angeles (1,752), Dallas (1,582), and Portland (1,374). The number of multifamily units under construction rose 14.5 percent year-over-year to 672,000 units. The outbreak of COVID-19 is expected to delay apartment construction due to the lack of government employees who play a critical role in construction projects by issuing permits and conducting inspections.
U.S. Capital Markets
According to Real Capital Analytics, closed transactions apartment sales during Q1 2020 totaled $30.6 billion, decreasing by 19.5 percent year-over-year. Despite uncertainties surrounding the pandemic and the “wait-and-see” approach, deals are still occurring, only at reduced levels.
The U.S average price per unit stood at $184,709, an annual growth of 12.4 percent. Investors exchanged more than 180,000 units, with cap rates averaging 5.5 percent, down 11 basis points annually.
Washington, DC had the top increase in sales volume, up 20.5 percent year-over-year. Among the major markets, New York was the only market that experienced a decline in sales volume, down 21.4 percent. In response to recent New York City rent regulations set in place in late 2019, many investors are apprehensive to invest in regulated properties and are concerned about loss of income and the inability to recoup costs of capital improvements.
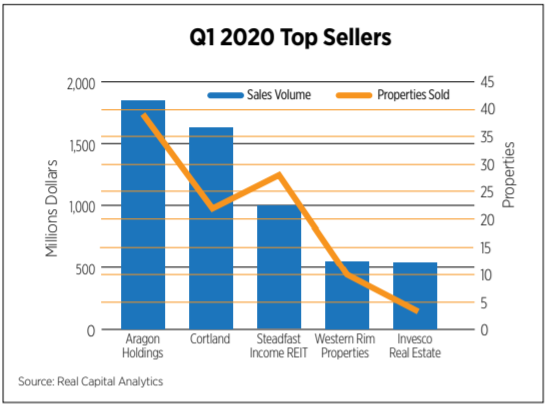
The private real estate investment company, Aragon Holdings, ranked first for top seller, exchanging 39 properties totaling over $1.8 billion during Q1. Other companies that sold off properties during the first quarter included Cortland, Steadfast Income REIT, Western Rim Properties, and Invesco Real Estate.
Apartment development companies with projects valued over $1.0 billion during the first quarter included Greystar and Hines. Other top developers included Lennar, USAA Real Estate, and Related Companies.
U.S. Economy
Of all the economic predictions over the last 12-18 months, one aspect came to fruition during the first quarter of 2020: the longest recovery in U.S. history did not die of old age. Not only did we not have to wait for unemployment rate figures to stay elevated or for Gross Domestic Product (GDP) to turn negative or for a sustained, inverted yield curve, but the U.S. economy was plunged into recession seemingly overnight. As Covid-19 began to spread across the country, government calls for social distancing, stay-at-home orders and the shutdown of non-essential businesses brought the economy to a halt.
The impacts were swift in the hospitality, airline and retail industries as travel restrictions were imposed, conferences and meetings were canceled and customer-facing businesses closed, although all industry sectors have been touched by the pandemic.
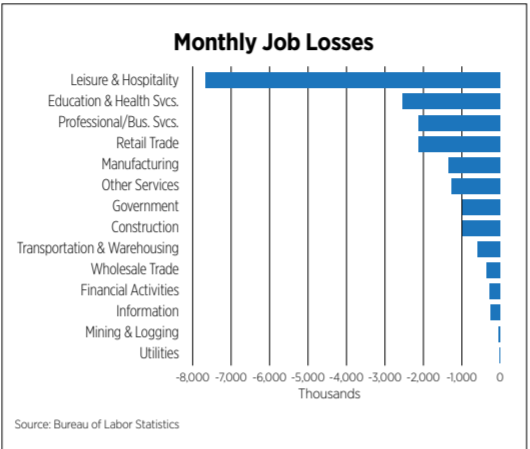
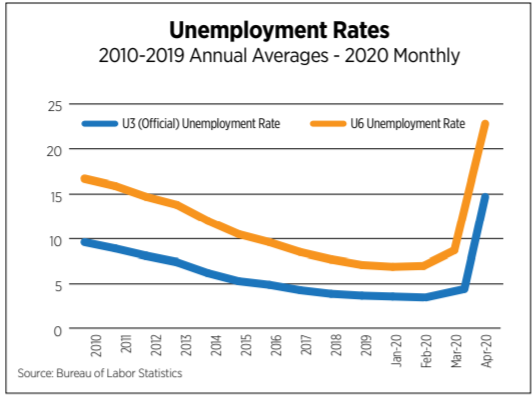
As March melded into April, economic data worsened and visuals of all indicators began to resemble a cliff, breaking decades-old historical records in most cases. A record 20.5 million jobs were lost in April alone and the unemployment rate experienced its largest monthly increase ever, climbing 10.3 percentage points to 14.7 percent. It is important to remember that in order to be counted as unemployed, a person needs to be actively seeking employment, something that is challenging at best due to stay-at-home orders and impossible at worst due to business closures. The U6 unemployment rate measures all unemployed people plus those marginally attached to the labor force (not actively seeking work now) plus those employed part-time for economic reasons. The U6 unemployment rate ballooned to 22.8 percent in April, another record. For context, the highest level of this measure of unemployment during the Great Recession was 17.2 percent.
First-quarter GDP, which had been on track for growth in the 2.0 percent range, declined 4.8 percent, a testament to the destructive final two weeks of the quarter. All components witnessed declines with consumer spending registering the largest contraction at 5.3 percent. Second-quarter projections are bleak with general consensus in the -30 percent range.
Forecasts for the recovery—its onset, its duration and its shape—vary widely due to the unprecedented nature of the downturn and the fact that a recovery is dependent on containing the virus so consumers get back to spending and businesses begin to invest again. Testing and tracing until a vaccine is readily available will be key to boosting both consumer and business confidence and avoiding a second shutdown.
Outlook
CBRE Econometric Advisors is forecasting four quarters of negative rent growth with a 6.7 percent decline from peak to trough and rents returning to their pre-pandemic levels by Q2 2022. RCLCO predicts the downturn for multifamily will most closely follow the last recession with 5 quarters of negative rent growth and a 6.5 percent decrease in rents.
Unsurprising, April rent collections were near normal as layoffs and furloughs began during the latter part of March, meaning some employees received their final paychecks just before rent was due. The subsequent arrival of stimulus and unemployment payments kept collections on track throughout the month, according to several property management software firms tracking the data. Through the first week of May, collections were stronger than expected although these data only track larger, institutional properties. For millions of small rental housing providers, the future is less certain.