Despite a strong recovery taking hold in 2021 among professionally managed and maintained properties, the 2021 NAA Survey of Income and Expenses in Rental Apartment Communities, based on 2020 financials, revealed just how hard the industry was hit across most income and expense categories.
Total revenue, measured as a percent of Gross Potential Rent (GPR), fell nearly 200 basis points from the prior year while operating expenses rose 60 basis points. This double whammy resulted in a 3.3% loss year-over-year in average Net Operating Income (NOI) per unit, the first decrease since 2010 in the aftermath of the Great Recession.
Delinquencies rose because of financial hardships among residents who lost their jobs, particularly those in the lower-paying services sector. A pullback in demand during the shutdown period also contributed to revenue declines. The desire by residents to stay put during the depths of the pandemic, coupled with the propensity of owners and operators to keep renewal rents flat, translated into far fewer opportunities to maximize revenue.
Operating expenses were impacted by apartment wear and tear as residents were home 24/7 for extensive periods of time. Even after lockdowns were lifted, work and school at home were a mainstay for the remainder of the year. But not every expense increase was a result of the pandemic.
2021 Survey Results
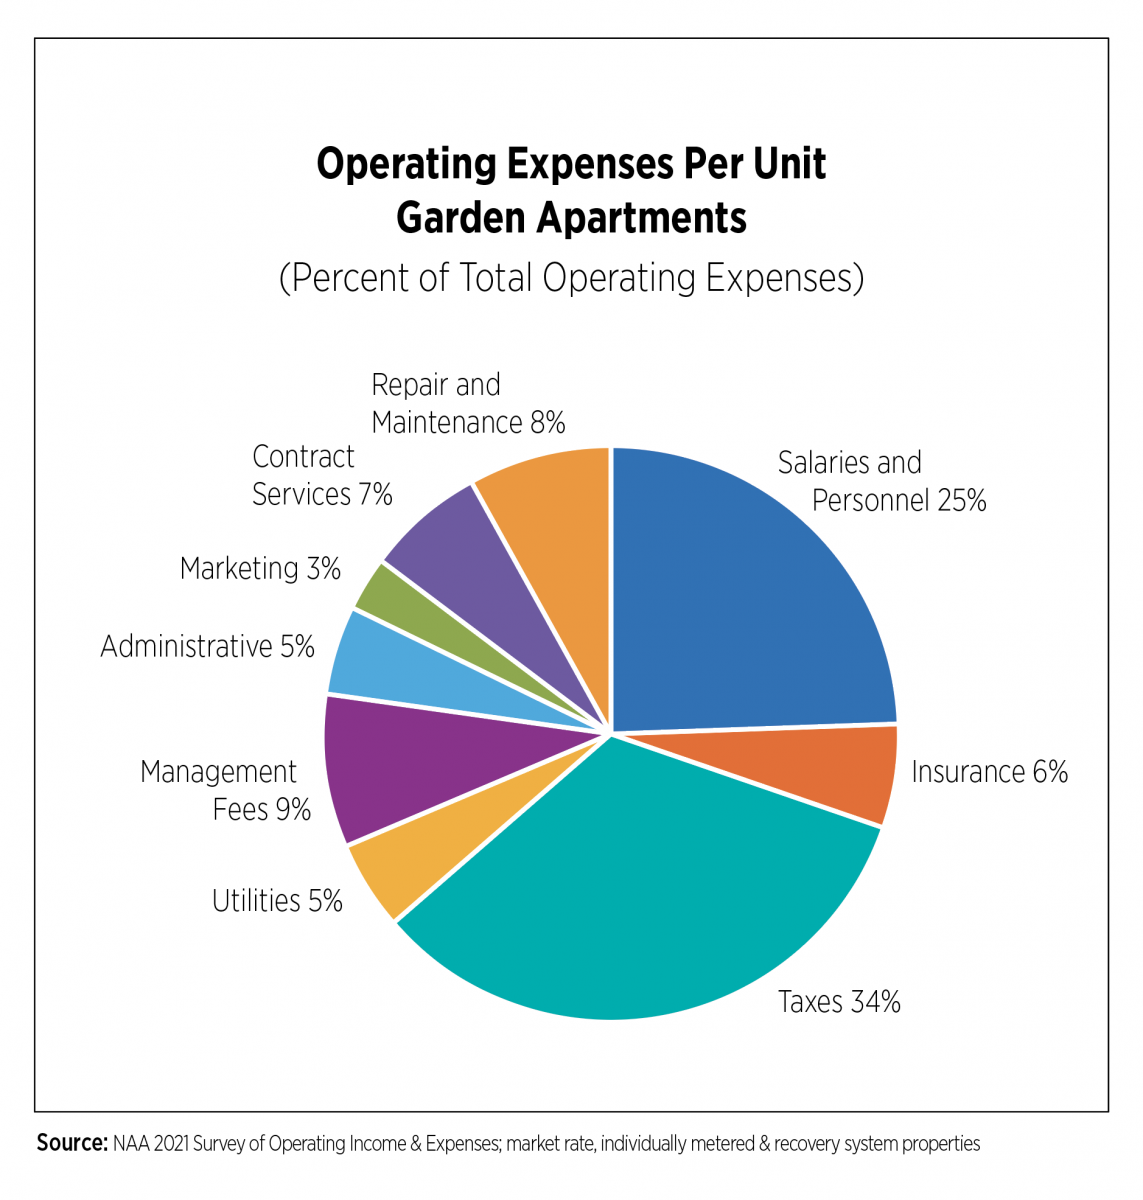
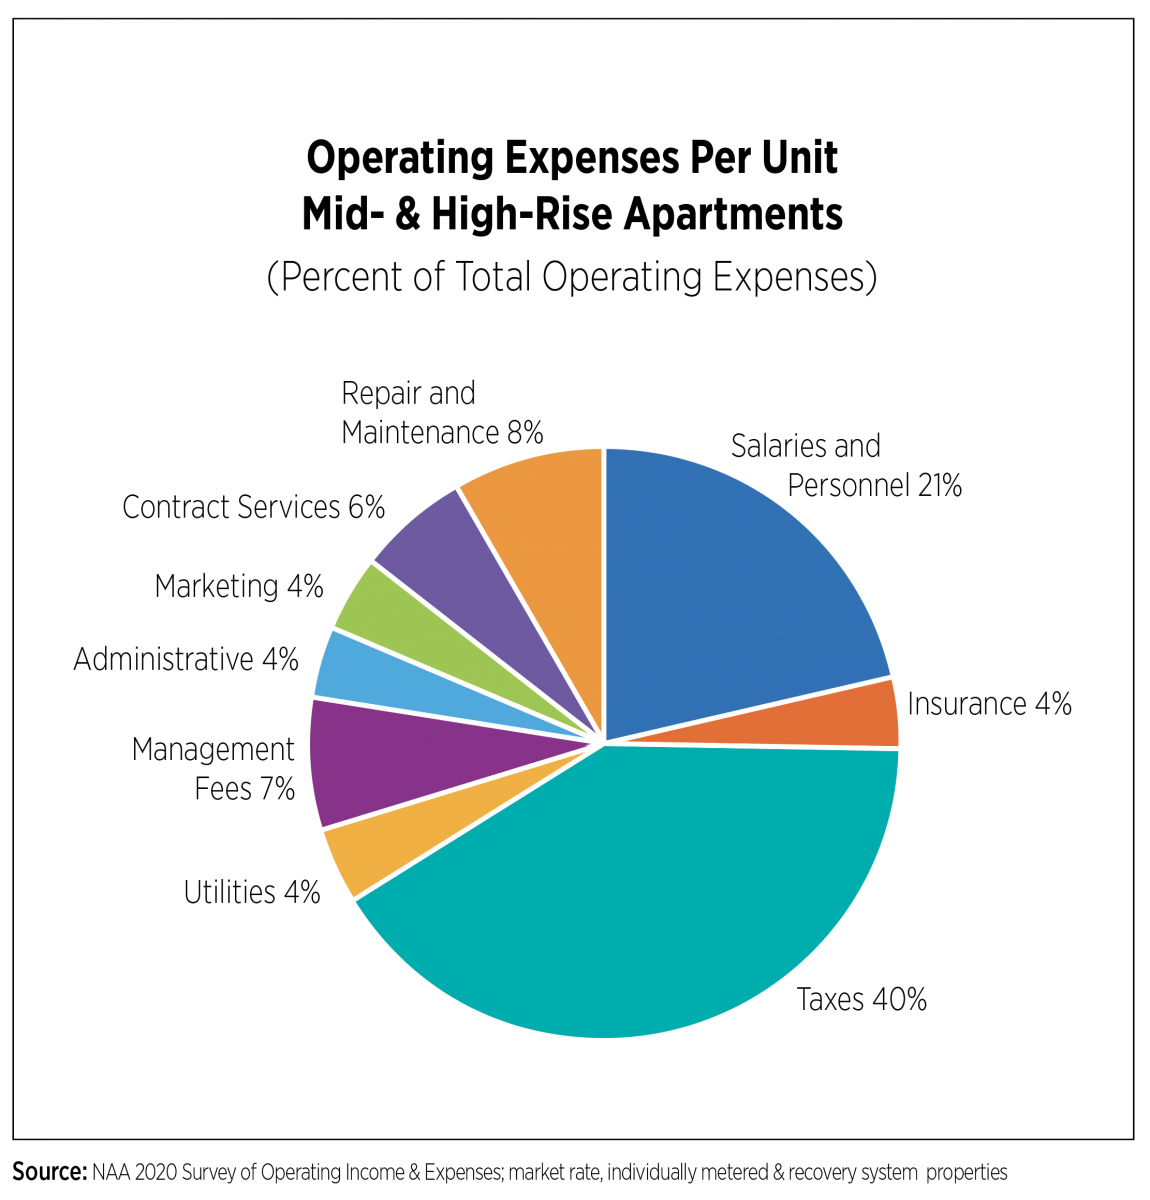
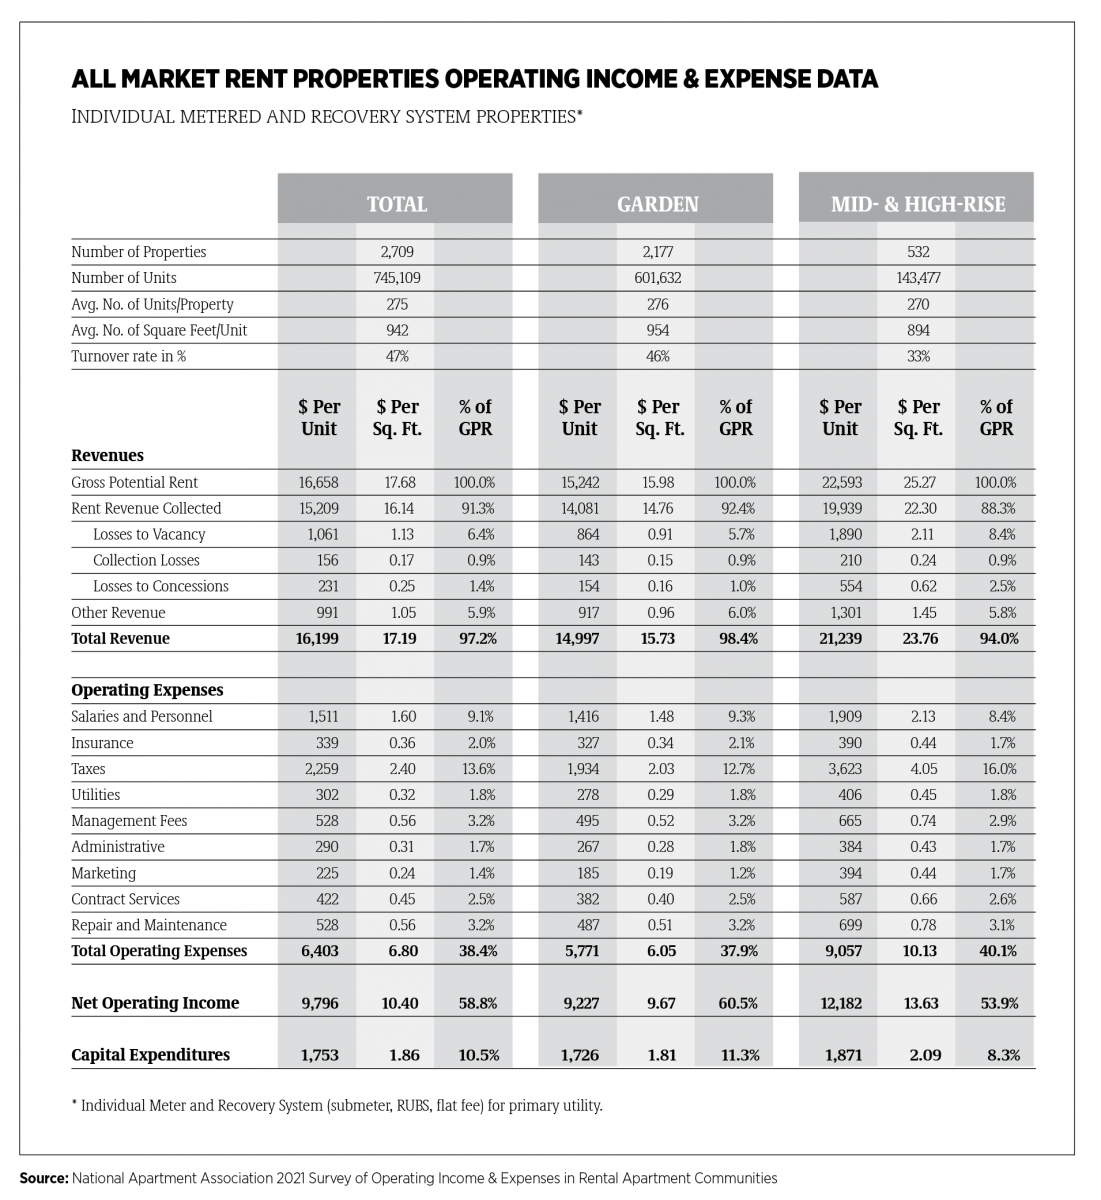
Statistical references within the analysis typically refer to total market rate, individually metered and recovery system properties, except where noted as garden style. Figures throughout the analysis are expressed as a percent of GPR, unless otherwise noted. Property taxes, insurance and repair and maintenance were the main drivers of cost increases. 2020 marked the ninth consecutive year for property tax increases, which comprised more than 35% of total expenses and 13.6% of GPR. Total operating expenses increased 2.6% from the prior year on a per unit basis.
Insurance costs per unit were increasing before the pandemic but skyrocketed in 2020, up nearly 19%. A recent survey of rental property owners conducted by NAA and other housing organizations revealed insurance premium increases were widespread across the industry. Sixty percent of survey respondents reported increases greater than 15% while one in 10 witnessed their premiums double or more than double in just one year.
In addition to apartment wear and tear, personal protective equipment and cleaning and sanitation supplies also added to the repair and maintenance line, which was up 0.2 percentage points of GPR. Salaries and personnel experienced modest increases, although we expect significant rises in 2021. Marketing expenses also ticked up as owners competed for residents in those markets that were hit harder by the pandemic. Resident relations spending, a sub-category of marketing that includes resident events, decreased as social distancing and other measures meant in-person events were few and far between.
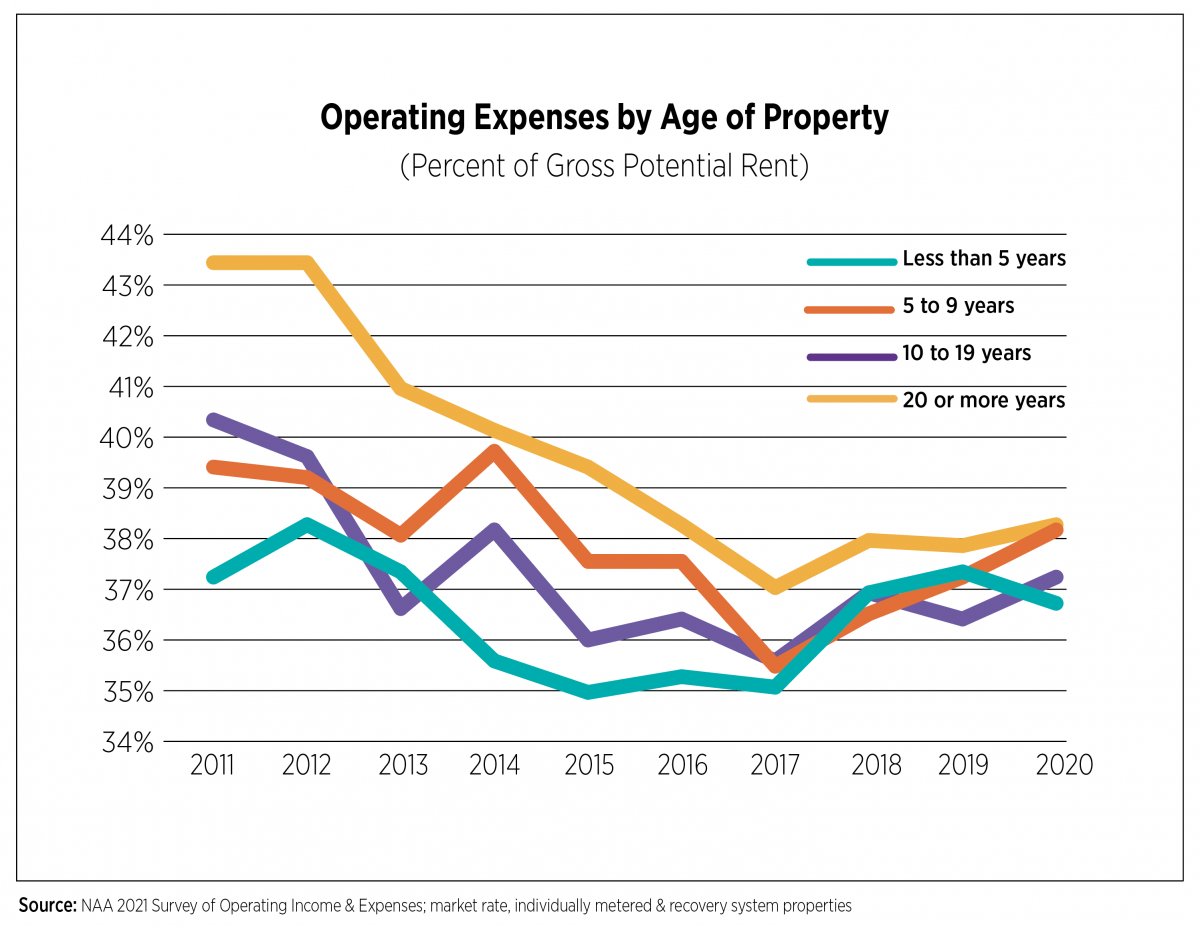
In terms of property age, the only market-rate garden-style properties that experienced a decline in operating expenses were those built after 2015, led by decreases in taxes and contract services. Properties built between 2010-2015 experienced the highest increases in operating expenses as well as the highest revenue losses. The oldest properties in our survey (built prior to 2000) had the smallest increase in operating expenses, mainly due to cutbacks in contract services.
Capital expenditures fell by 0.4 percentage points as major projects were put on hold to control expenses in an uncertain environment. In fact, in the July 2020 COVID-19 Impact Survey, conducted by NAA in partnership with the Institute of Real Estate Management (IREM) and CEL & Associates, Inc., survey respondents reported freezing capital expenditures for portions of 2020.
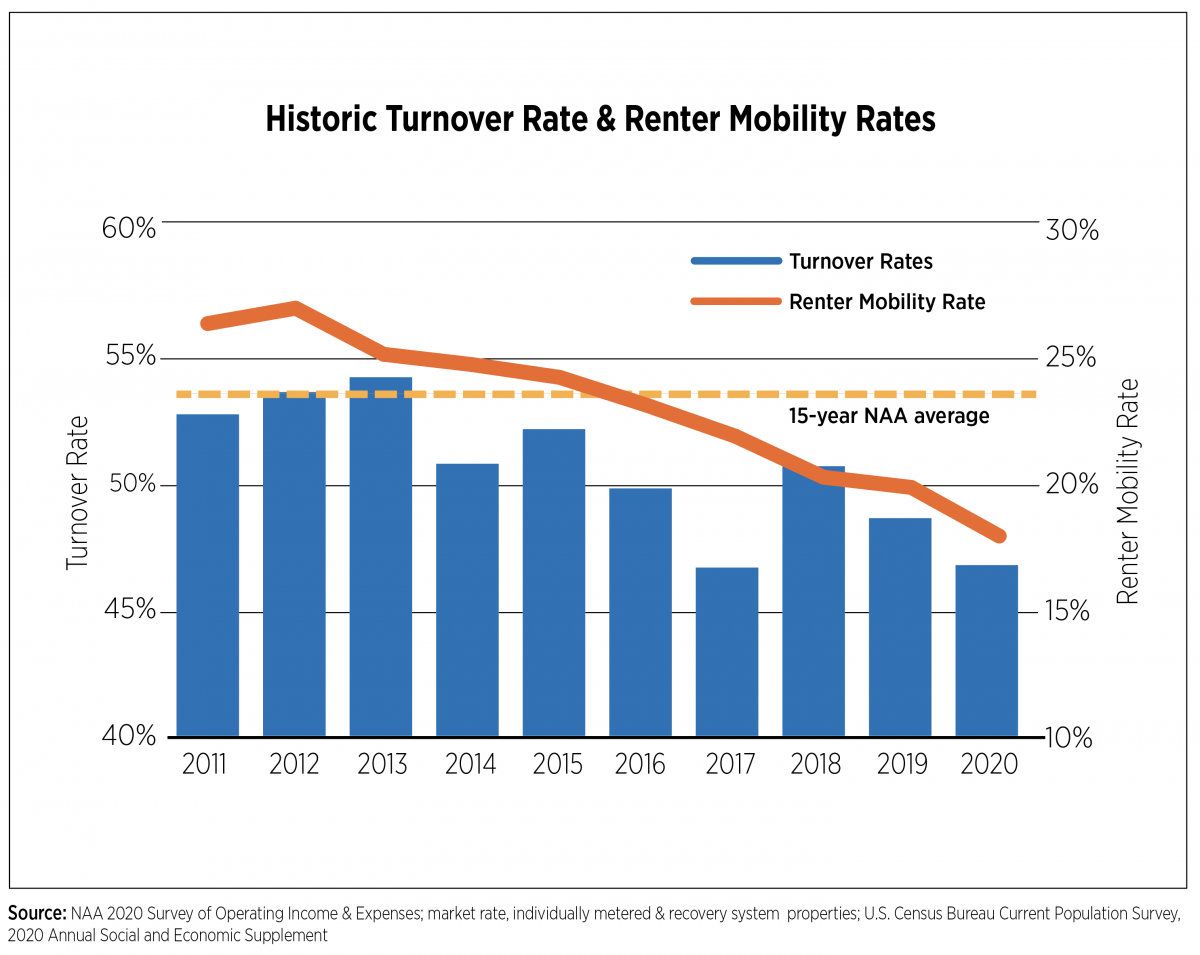
Turnover rates were among the lowest in the survey’s history at 46.9% and well below historic averages. While there were numerous reports and data series released last year showing strong migration trends, by and large, more apartment residents decided to renew, either month-to-month or locking in their current rental rate longer term. By region, turnover was lowest in garden properties in California, averaging 40%, and highest in mid-rise/high-rise properties in Florida, averaging 55%. California had some of the strongest and lengthiest COVID-19 restrictions in the county, contrasted against Florida, which lifted many of its restrictions very early on in the pandemic. The survey findings match the Census Bureau’s 2020 Current Population Survey supplement, which found mobility rates among all renter households at 17.8%, their lowest point since the data started being collected in 1988.
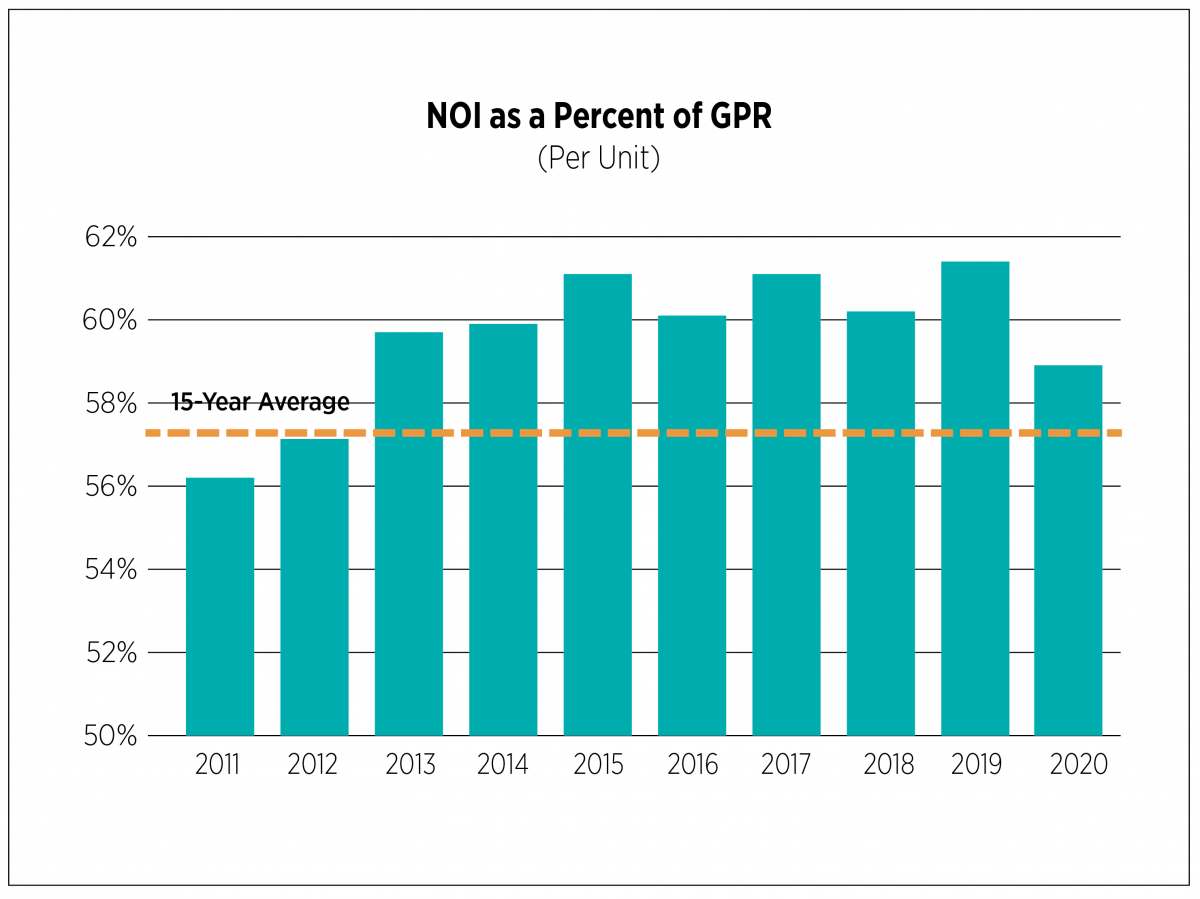
After running above 60% of GPR for five years, NOI fell to its lowest level since 2012, but at 58.8%, it remained above long-term averages. In addition to a 1.2 percentage point drop in rent revenue, ancillary revenue also declined by 0.7 percentage points. The decrease in amenity fee revenue was driven by owners and operators who waived or refunded these fees as many community-wide amenity spaces were closed during the pandemic. A slight uptick in parking fee revenue, as many residents abandoned public transportation and purchased new or used cars, was not enough to offset declines in other ancillary revenue categories.
Source: NAA 2021 Survey of Operating Income & Expenses; market-rate, individually metered & recovery system properties.
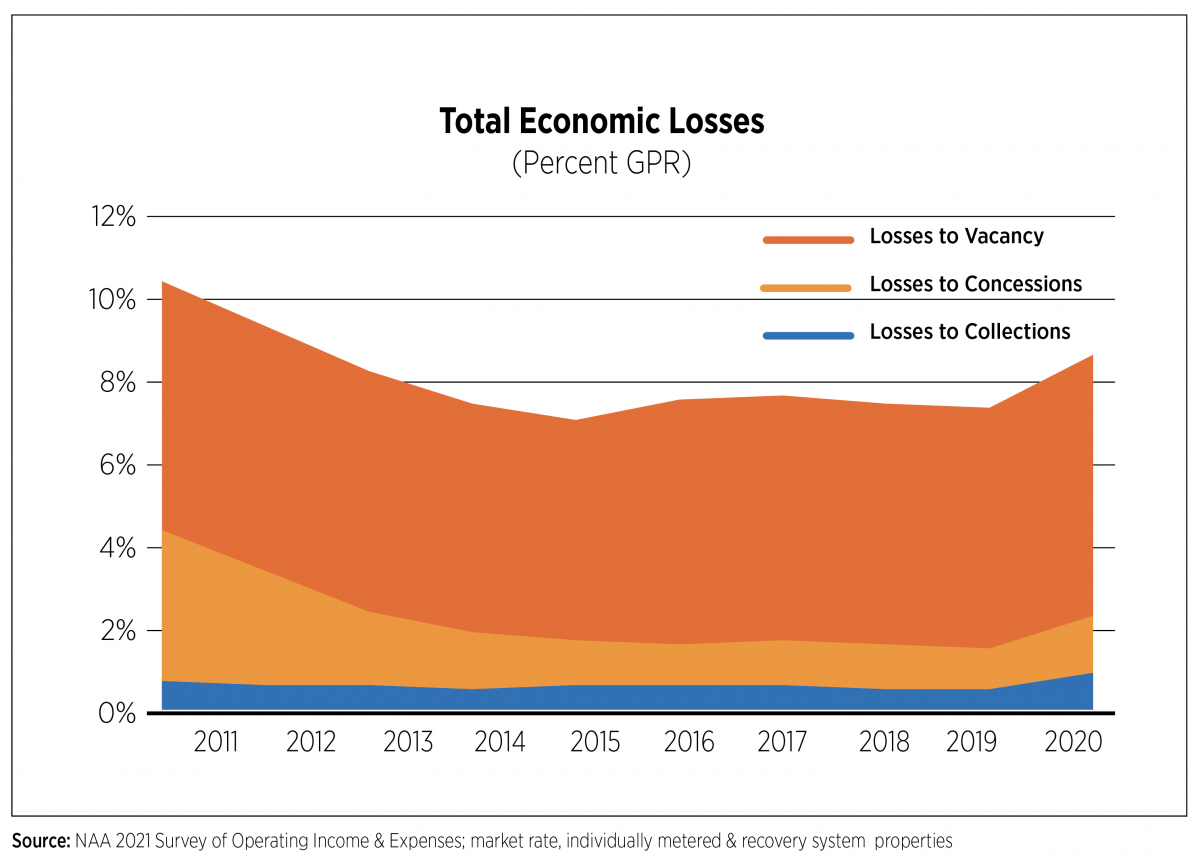
Economic losses increased across all categories, up 1.2 percentage points, and are at their highest level since 2013 at 8.7%. We must return to 2003 to find higher collection losses while losses to concessions and losses to vacancy, the largest category, increased as well. Delinquencies remain a major issue in 2021. Among an informal survey of mid-sized NAA members (owning or operating 10,000-20,000 units), an average of 9% of units were found to be delinquent with rent debt per unit north of $5,000. Similar trends can be seen among larger operators who have debt on their books from residents not paying rent as well as residents who are behind on payment plans.
Metropolitan Area Overview
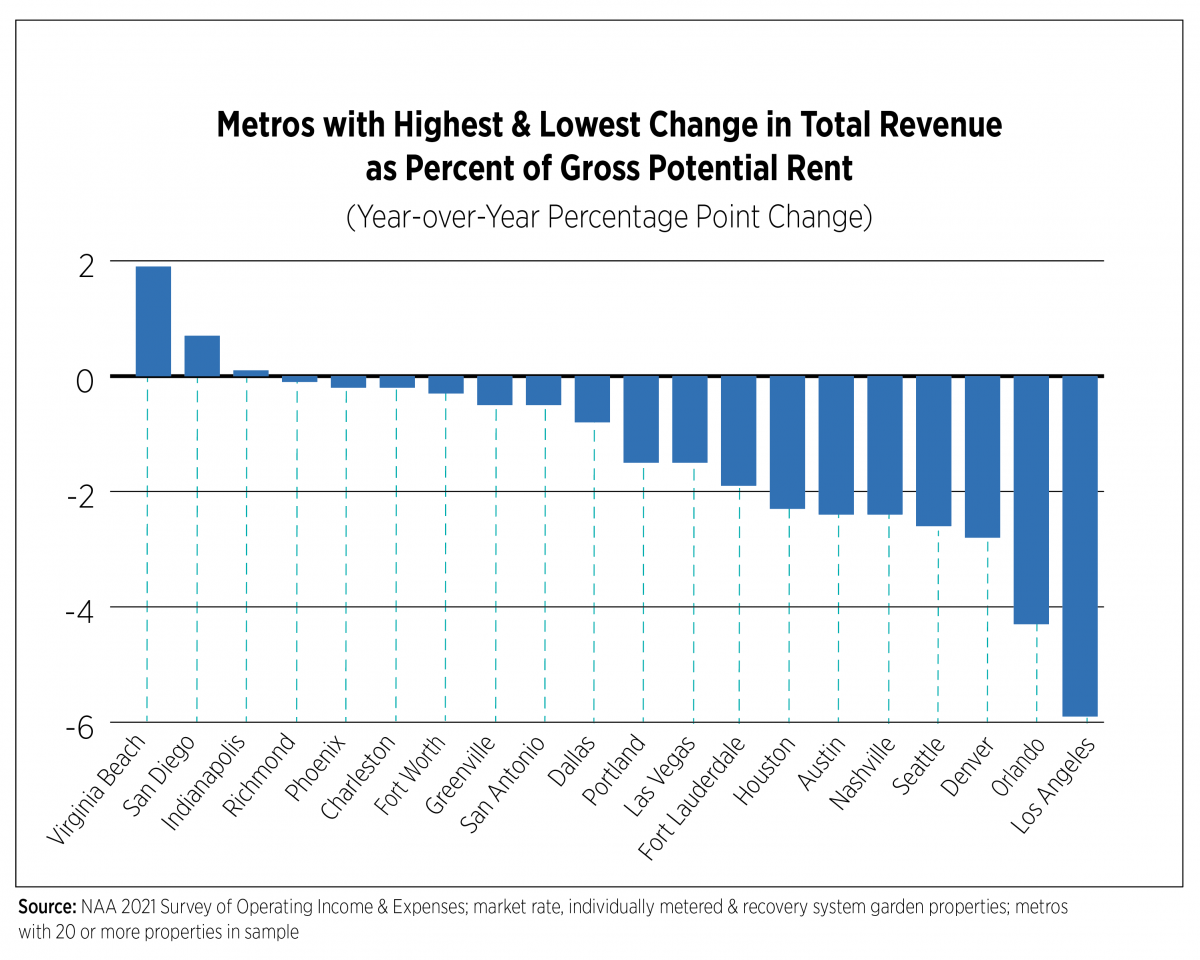
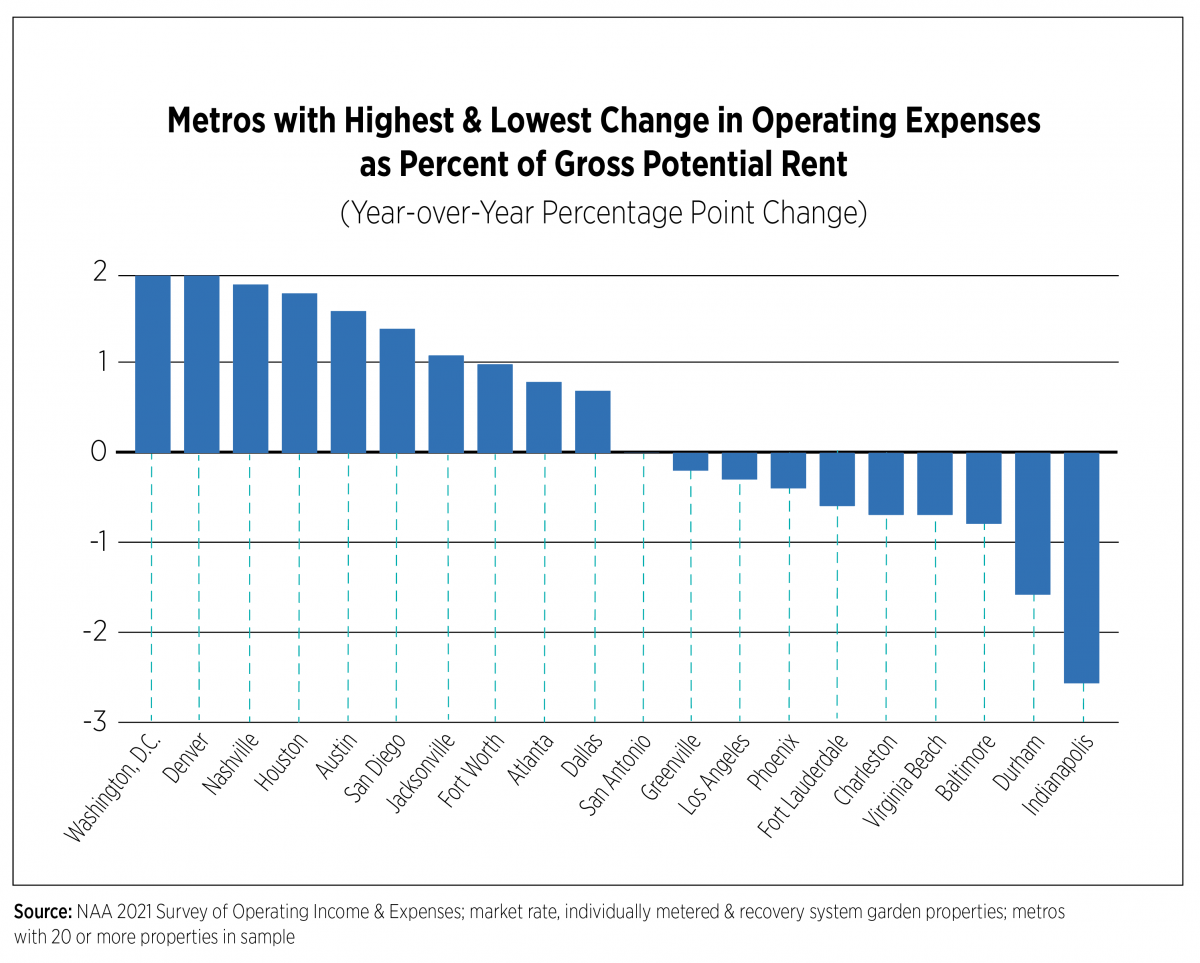
The full report includes income and expenses statistics on market-rate apartment properties for 67 metropolitan areas. This metro area analysis focuses on year-over year trends for operating expenses, total revenue, additional revenue and net operating income for garden-style, individually metered and recovery system properties in metro areas with 20 or more properties in the sample. The top 10 metros for largest increases and decreases in revenue and operating expenses are displayed in the charts that follow.
Total revenue per unit ranged from $12,329 in Indianapolis to $23,384 in Los Angeles. Decreased rental rates and unpaid rent brought many challenges for apartment owners and operators during the COVID-19 pandemic. Virginia Beach, Va., San Diego and Indianapolis were the only markets that registered increases in total revenue. Los Angeles ranked lowest, declining 5.9 percentage points, likely a result of outmigration that was common among the nation’s large coastal cities during the pandemic.
Amenity fees were the highest source of additional revenue, yet Denver, Indianapolis, Greenville, S.C., and Nashville were the only markets that posted percentage point increases from 2019 to 2020. Fourteen out of 28 markets saw a decrease in amenity fees year-over-year, most notably in San Antonio, which declined by 1.1 percentage points. Unlike amenity fees, 13 markets saw a year over- year increase in parking fees. During COVID-19, demand for vehicles surged as the use of public transportation dropped dramatically due to people working from home or simply opting to avoid public transit in fear of contracting the coronavirus. In a survey of Gen Z renters conducted by NAA/SatisFacts/ApartmentRatings in November/December 2020, 91.4% of respondents cited guaranteed parking as a valuable community amenity. Additionally, suburban markets likely experienced a boost in demand for parking as renters migrated to more affordable areas with limited access to public transit. Greenville and Jacksonville saw a 0.4 percentage point increase in parking fees, followed by Fort Worth, which grew 0.3 percentage points.
Net operating income per unit varied from $14,923 in Los Angeles to $6,356 in San Antonio. Indianapolis had the highest growth in NOI, experiencing a 2.8 percentage point gain, followed by Virginia Beach, which increased by 2.6 percentage points. In contrast, NOI in Los Angeles dropped 5.6 percentage points. During 2020, smaller markets outperformed larger markets by yielding solid occupancy rates and rent growth because of increased demand.
Operating expenses ranged from $4,354 per unit in Las Vegas to $8,461 in Los Angeles. Indianapolis was also the leading market for reduced operating expenses, declining by 2.6 percentage points. Reductions in salary/personnel costs, repair and maintenance and contract services were the key contributors to improved operating expenses. Washington, D.C. and Denver led in increased operating expenses, each up 2.0 percentage points due to increases in repair and maintenance, taxes, administration, salary/personnel costs, insurance and management fees.
Outlook
At the time of this writing, the effects of the Delta variant were beginning to show in economic indicators and forecasts. Far fewer jobs were added in August than were anticipated and consumer sentiment hit a 10-year low, according to the University of Michigan. GDP growth forecasts have been downgraded as a summer surge of COVID cases and deaths coupled with fears of new, potentially vaccine-resistant variants are causing consumers and businesses to pause. As the pandemic endures, the risks to the economy are weighted to the downside.
Rental housing market bifurcation is persisting well into 2021. Larger apartment owners and operators are generally weathering the pandemic, particularly those with more diversified portfolios who can take advantage of record-breaking demand in some markets and sectors offsetting weaker conditions elsewhere. But for small owners and operators who, in some cases, did not receive rent payments for more than one year, the story is different. Eviction moratoriums and the slow rollout of emergency rental assistance funds have left them struggling to pay mortgages and other expenses. A survey of single-family rental housing owners conducted by the National Rental Home Council in March 2021 found that 23% of respondents had already sold one or more of their properties, putting much-needed affordable rental stock at risk.
The industry as a whole must face two massive challenges in 2022 and beyond: The probability that eviction moratoriums and other housing-adverse policies like rent control gain even more traction; and the labor market. A record number of job openings and increased wages make for an employee’s market, evident by the unprecedented number of employees quitting their jobs. While the surging inflation rate is expected to fizzle out during the next six months, employment costs (wages, salaries, bonuses, benefits) will continue to rise as long as the labor market remains completely out of balance.
About the Survey
The survey was conducted, compiled and tabulated by CEL & Associates, Inc. Special thanks to Janet Gora, Managing Director, CEL & Associates, Inc. A total of 3,223 properties with 50 or more units containing 827,729 units are represented in this year’s report covering financials from 2020.
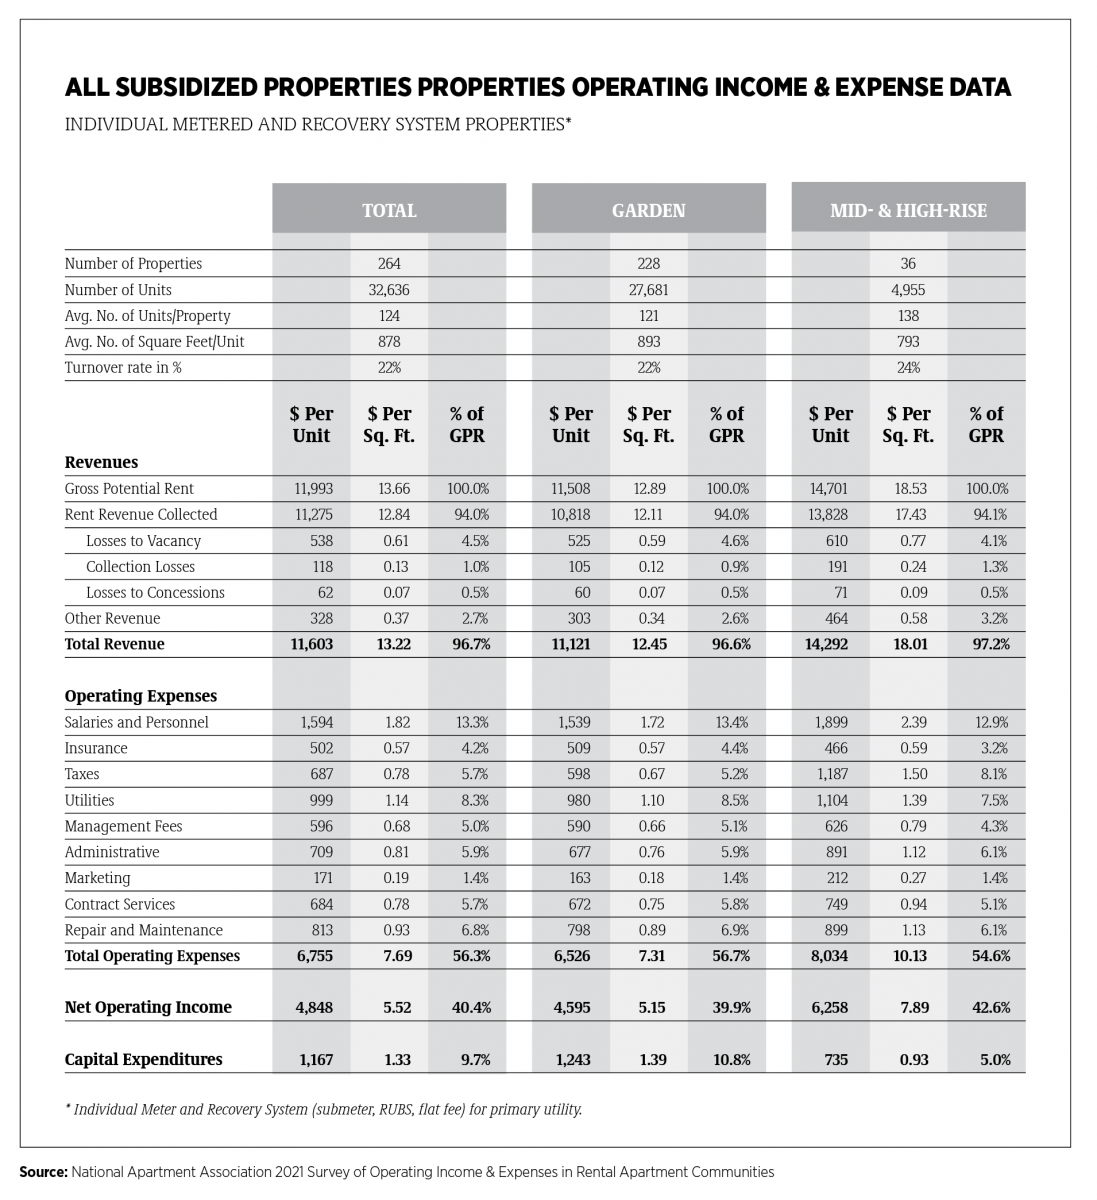
Data were reported for 2,824 market-rent properties containing 776,262 units and 399 subsidized properties containing 51,467 units. (Surveys with partial data or apparent problems that could not be resolved were not included.)
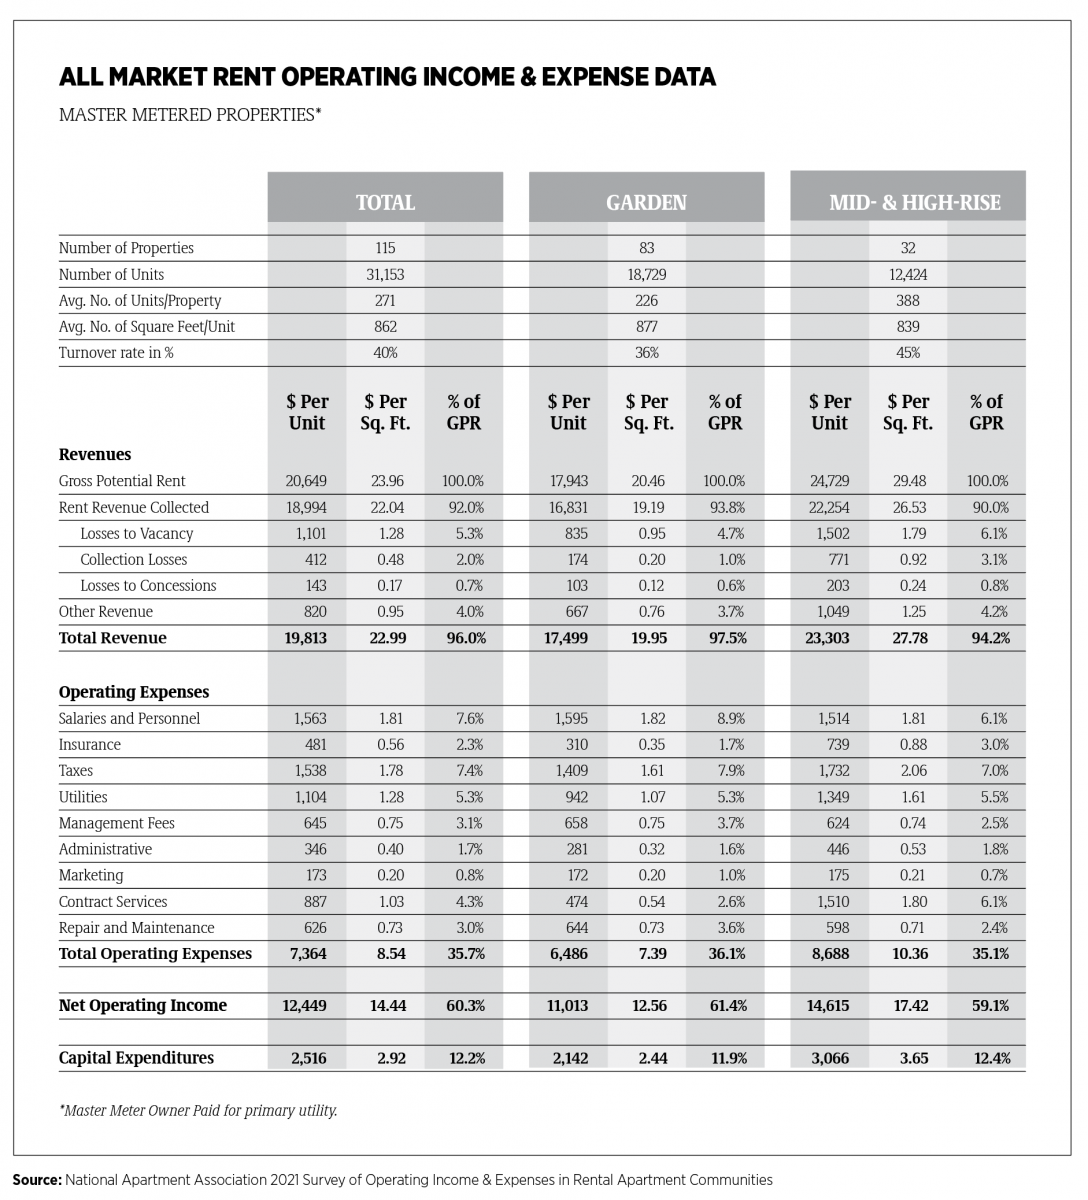
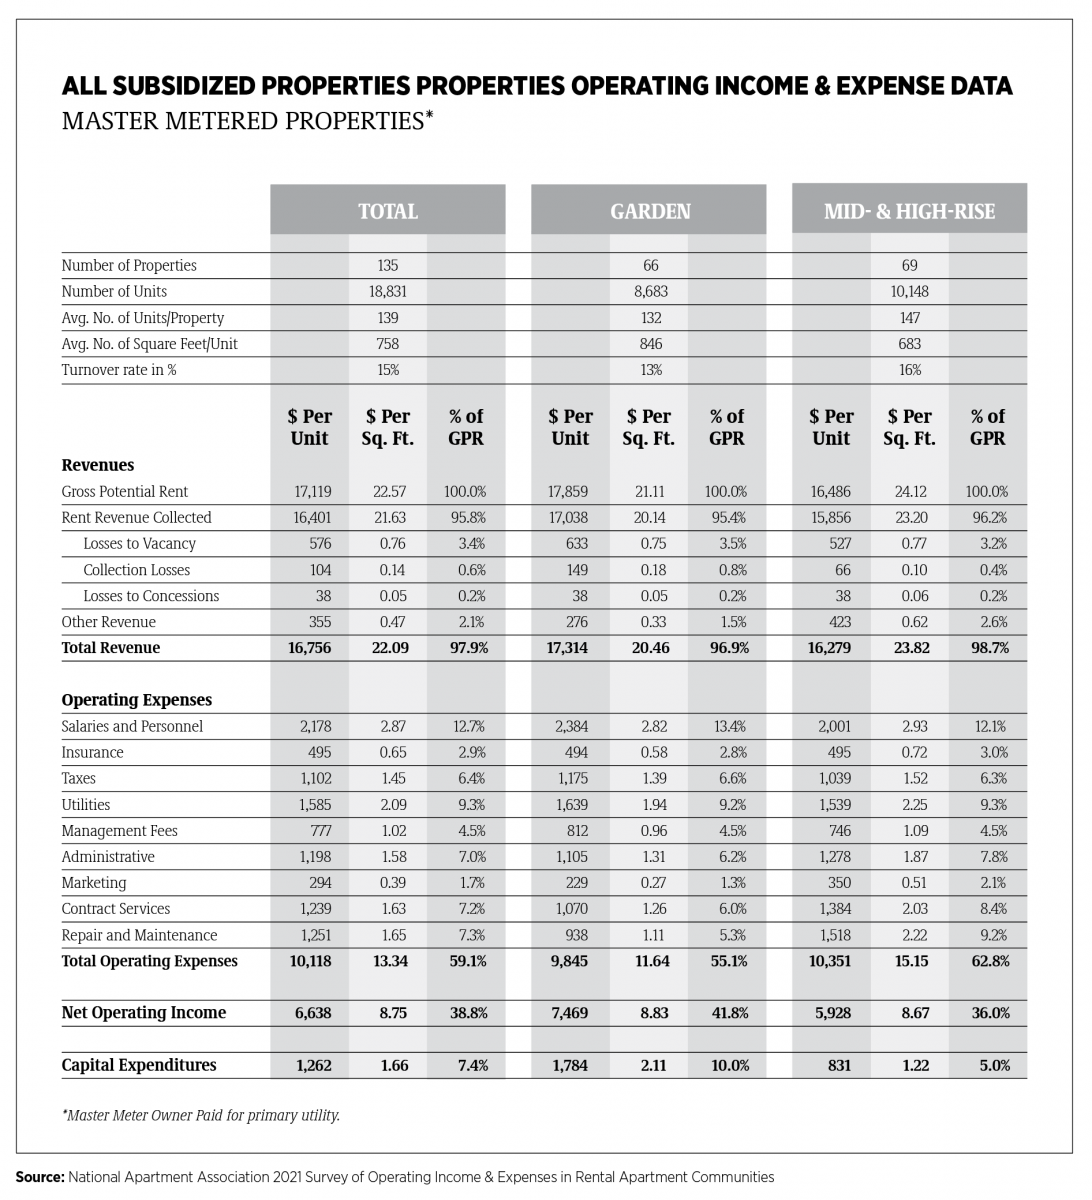
The report presents data from stratifications of garden-style and mid-rise/high-rise properties; it is further segmented by individual meter and recovery systems (e.g., submeter, RUBS, flat fee), and master-metered utilities, for the property’s primary utility. Survey data is presented in three forms: Dollars per unit, dollars per square foot of rentable area and as a percentage of gross potential rent (GPR). Responses from garden properties with individual meter/recovery utilities represent 77% percent of the market-rent units and 57% percent of the subsidized units. References to statistics within the analysis typically refer to total market rate, individually metered and recovery system properties, except where noted as garden style.
The market-rent segment generally has more units per property and greater floor area per-unit than the subsidized segment. The average size (# of units) of individual meter/recovery, market-rent properties is 275 units in 2020 (280 in 2019), and 124 units in subsidized properties in 2020 (166 in 2019). Rentable floor area averaged 942 square feet (939 in 2019) for market-rent apartments and 878 square feet (915 in 2019) for the subsidized units.
The full report contains detailed data summarized for NAA’s 10 geographic regions, and 67 metropolitan areas met the separate reporting criteria for market-rent properties. Sufficient numbers of subsidized properties were submitted for 10 metropolitan areas.
This report also includes results for all “other” properties at the state level located in metro areas that did not meet criteria for separate reporting. Non-metro area reporting also is included at the state level. Tables for these “other” market-rent properties are provided for 18 states and for subsidized properties in 13 states. The NAA survey includes standard utilities and distinguishes expenses and recoveries by utility configuration to confirm that net utilities are reported. This level of standard utility expense more consistently represents utilities for comparison between properties. Not all properties are able to designate this detail. The additional utility reports represent those properties that offer utility detail for comparison. Additional reporting presented for questions with expanded segmentation areas represents those properties that reported detail. Those that did not were reported as “other.”
Glossary of Terms
Administrative. Total monies spent on general and administrative items such as answering service, donations, mileage reimbursement, bank charges, legal/eviction charges, postage, telephone/fax/Internet charges, office supplies, uniforms, credit reports, permits, membership dues, subscriptions, data processing, etc. Does not include any payroll-related expenses.
Capital Expenditures. Capital Expenditures are separated by the categories listed (renovations, replacements and “other”). All “other” CapEx expenses would include the sum of any items not specifically listed above. A zero on the line meant there were no capital expenditures.
Contract Services. Contract Services are separated by the categories listed (landscaping, pest control, security and “other”). All “other” contract services expenses would include the sum of any items not specifically listed above (e.g., Snow removal and other services provided on a contract basis). Trash removal is not included here.
Gross Potential Revenue/Rent Residential. Total rents of all occupied units at 2020 leaserates and all vacant units at 2020 market rents (or fiscal year end).
Heating/Cooling Fuel. Type of fuel used in apartment units.
Insurance. Includes property hazard and liability and real property insurance and does not include health/payroll insurance.
Maintenance. Total monies spent on general maintenance, maintenance supplies and uniforms, minor painting/carpeting repairs, plumbing supplies and repairs, security gate repairs, keys/locks, minor roof/window repairs, HVAC repairs, cleaning supplies, etc. Does not include any payroll related expenses or non-recurring capital expenses. Contract services are separately reported.
Management Fees. Total fees paid to the management agent/company by the owner.
Marketing. Marketing expenses are separated by the categories listed (internet, print, resident relations and “other”). All “other” marketing expenses would include the sum of any items not specifically listed above. (e.g., locator fees, signage, model expense, etc.) NOTE: Rent concessions are not included.
Net Commercial Square Footage. Total rentable square feet of commercial floor space.
Net Rentable Residential Square Feet. Total rentable square feet of floor space in residential units only. Area reported includes only finished space inside four perimeter walls of each unit. Common areas are excluded.
Other Revenue. Monies received are separated by the categories listed (amenity fees, laundry, parking, pet fees, storage and “other”). All “other” would include the sum of any items not specifically listed above. (e.g., vending, deposit forfeitures, furniture, late fees, termination fees, application fees, etc.) NOTE: Interest income or utility reimbursements are not included. (Utility reimbursement/recovery is subtracted from gross utility costs.)
Payroll Costs. Gross salaries and wages paid to employees assigned to the property in all departments. Includes payroll taxes, group health/life/disability insurance, 401(k), bonuses, leasing commissions, value of employee apartment allowance, workers’ compensation, retirement contributions, overtime and other cash benefits.
Rent-Controlled Property. A property is subject to rent controls through local or state government regulations. This does not apply if rents are controlled through a government program that provides direct subsidies.
Rental Revenue Commercial. Total rent collections for commercial space after vacancy/administrative, bad debt and discount or concession losses.
Rental Revenue Residential. Total rent collections for residential units after vacancy/administrative, bad debt and discount or concession losses.
Revenue Losses to Collections. Amount of residential rents not received due to collection losses.
Revenue Losses to Concessions. Amounts of gross potential residential rents not received due to concessions.
Revenue Losses to Vacancies. Amount of rental income for residential units not collected because of vacancies and other use of units, such as models and offices.
Subsidized Property. A property that has controlled rents through a government subsidizedprogram. (Low-income housing.)
Taxes. Total real estate and personal property taxes only. Does not include payroll or rendering fees related to property taxes or income taxes.
Tax-Exempt Bond or Housing-Credit Property. A property that has received tax-exempt bond financing and/or is a low-income tax credit property.
Total Operating Expenses. Sum of all operating costs. The sum of all expense categories must balance with this line, using total net utility expenses only. Does not include debt service or any one-time extraordinary costs.
Turnover. Number of apartment units in which residents moved out of the property during the 12-month reporting period.
Utilities. Total cost of all standard utilities and each listed type, net of any income reimbursements for or from residents (i.e., submeter, RUBS, flat fee or similar system).
Utility Configuration. Whether electric, gas, oil and water/sewer utilities to individual units in subject property are: Master Metered, Owner Paid; Master Metered with a Resident Recovery System, (submeter, RUBS, flat fee); Individual Meter, Resident Paid. Report grouping is based on the configuration of the primary utility for the residents.
Thank You to Our Participating Companies
A special note of appreciation from NAA to the 132 firms who donated their time to accumulate the data necessary to make this survey valuable. The following companies and their officers provided 20 or more properties for the 2021 Survey of Operating Income & Expenses in Rental Apartment Communities.