Economic Indicators
The Labor Market
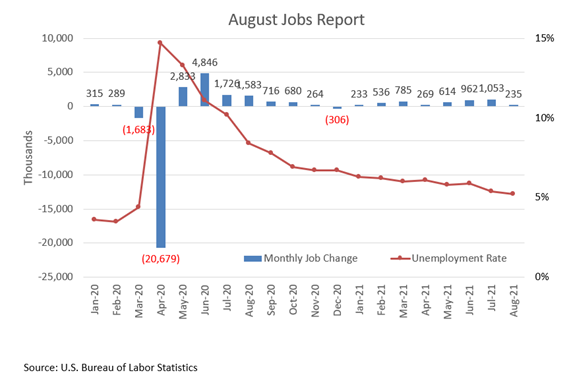
The August jobs report disappointed with fewer jobs added than anticipated, but enough to cause the unemployment rate to tick down to a new pandemic low of 5.2%.
The 235,000 new jobs bring the pandemic deficit down to 5.3 million jobs lost.
Gains were registered in professional/business services, transportation/ warehousing, and private education.
Unemployment Claims
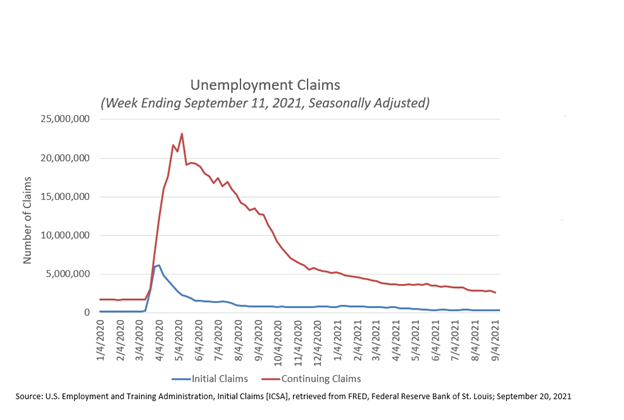
Initial claims for unemployment edged up from their pandemic low the prior week, mainly due to Hurricane Ida.
Continuing claims (through September 4) were also at a pandemic low, totaling 2.7 million.
Consumer Sentiment
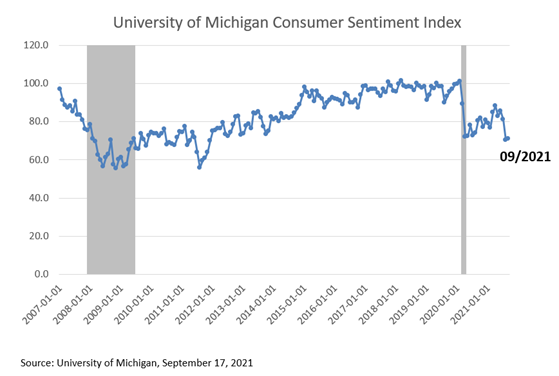
Consumer sentiment moderated in September after an 11-point plunge in August when it hit the lowest level since 2011.
The Delta variant and inflation fueled consumers’ pessimism with the latter having potential implications on spending patterns in the coming months.
Personal Saving Rate
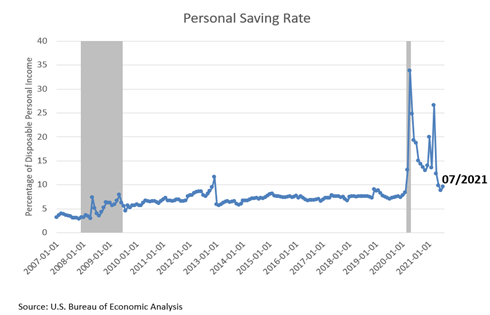
The personal saving rate fell to the 9-10% range over the past 3 months, now only slightly elevated from pre-pandemic levels.
The waning of fiscal support will cause the saving rate to further moderate towards longer-term averages.
Small Business Optimism
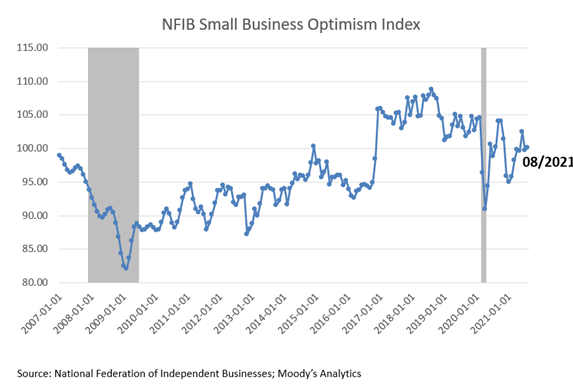
The Small Business Optimism Index inched up to 100.1 in August.
32% of survey respondents plan to hire, up from 27% last month, an indication that business conditions are moving in the right direction.
About half reported having difficulty filling jobs while 26% plan to increase compensation.
The Back to Normal Index
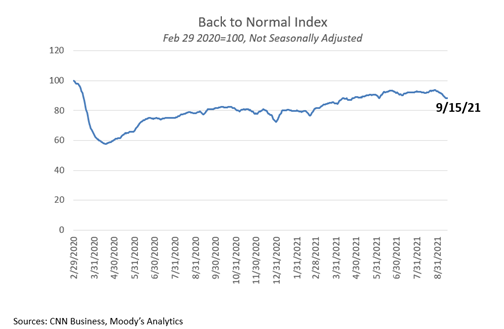
The Back to Normal Index tracks twelve high frequency data series plus monthly employment figures, using February 29, 2020 as the baseline for “normal.”
The index exhibited signs of weakness over the last 10 days, primarily due to a decrease in restaurant visits and airport passenger traffic, activities being impacted by the persistent spread of the virus.
Home Price Index
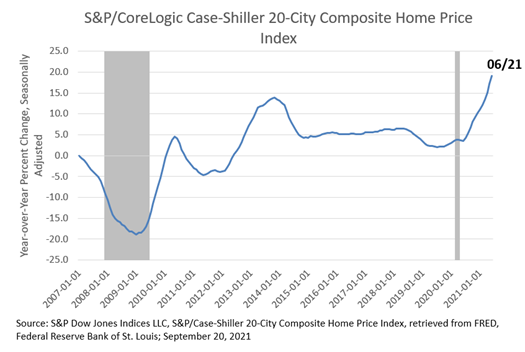
The S&P/CoreLogic Case-Shiller 20-City Composite Home Price Index reached another new high in June, increasing 19.1% year-over-year.
There has been little variation in the cities with the highest growth rates: Phoenix (29.3%), San Diego (27.1%) and Seattle (25.0%) continued to top the list.
New Home Sales
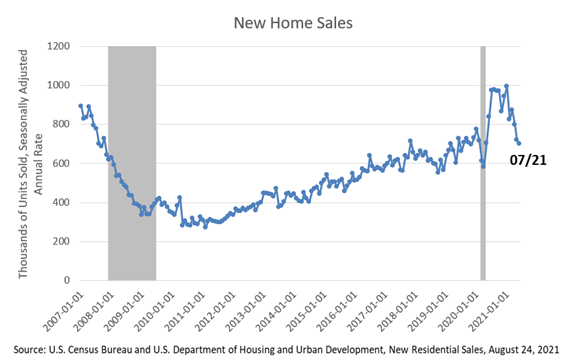
After declining for 3 months, new home sales ticked up slightly in July.
On a year-over-year basis, sales are down 27.2% following last summer’s buying frenzy.
Although the months of supply increased substantially over the past year to 6.2, a run-up in price appreciation has dampened demand.
New Home Building
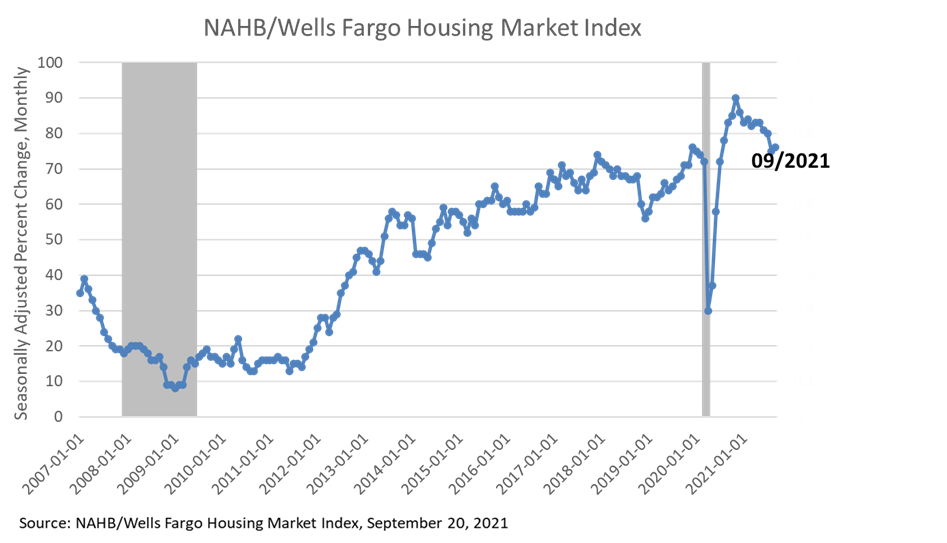
Overall homebuilder confidence improved slightly in September but remained somewhat muted.
The index which measures buyer traffic increased by two points but was well below levels seen earlier this year and later in 2020.
Price pressures eased on some materials, but labor market and supply chain issues continued to challenge builders.
Housing Permits
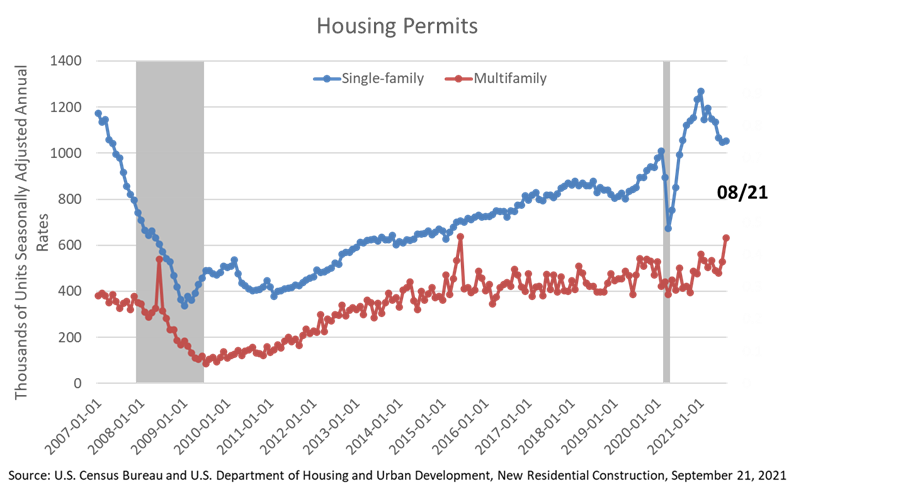
Multifamily construction permits reached a six-year high in August with 632,000 permits issued on an annualized basis, a good indication of robust new supply in 2022.
Single-family permits have topped 1,000 annual units for 13 consecutive months.
Housing Starts
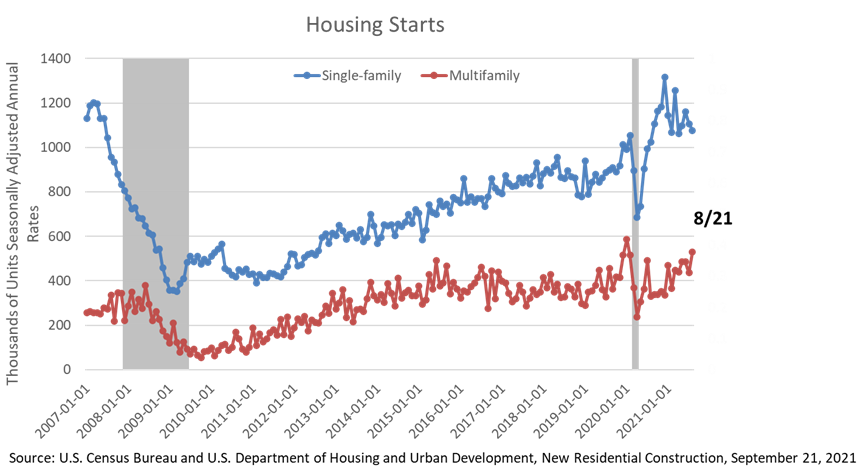
Multifamily construction starts hit a new pandemic high at 530,000 annualized units.
According to NAHB’s Home Building Geography Index, multifamily construction has increased significantly in small metro core markets as well as suburban markets.
Apartment Industry Indicators
Apartment Rental Rates
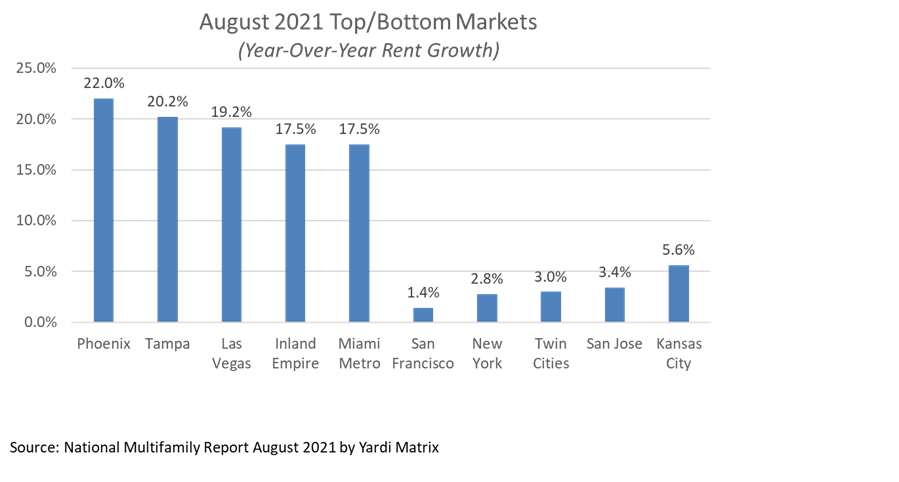
Multifamily asking rents increased significantly by 10.3% year-over-year basis in August to $1,539.
All top 30 metros tracked by Yardi had positive year-over-year rent growth for the first time since the beginning of the pandemic.
Apartment Investment Trends
The 2021 Mid-Year Powerhouse Poll data was conducted by Berkadia July 2021 to assess expected commercial real estate activity and opportunities for the second half of 2021. The sample was based among Berkadia professionals throughout the U.S., totaling 179 overall respondents.
Key finding:
- While GSEs are expected to remain the primary source of financing, the reduced caps and the availability of capital have seen debt funds more active in the market.
- Inflation and interest rates continue to gain ground as trends on the radar for lenders and investors alike as the impact of COVID on the economy evolves.
- 78% of Berkadia professionals expect an increase in multifamily transactions by the end of 2021.
- In upcoming months, investor interest will be focused on Class B and Class A housing.
- The Southeast and Southwest regions are expected to be of most interest to institutional investors.
- 45% of respondents believe modifying tax credit policy will have the greatest impact on the affordable housing crisis.
Source: Berkadia 2021 Mid-Year Powerhouse Poll-September 2021
Student Housing
Of the 200 colleges and university which Moody’s Analytics REIS tracks, roughly 37% are requiring coronavirus vaccines.
While there are still questions regarding in-person strategies, conditions are expected to look better than last year during the height of the pandemic however still above their pre-COVID levels.
For Fall 2021-Fall 2022, the student housing sector is expected to see vacancies fall from 10 basis points for properties renting by the unit to 20 basis points for properties renting by the bed.
Rents are expected to decline by 1.8% for properties renting by the unit to a decline of 2.7% for properties renting by the bed.
The largest rent decline for properties by bed are expected in the Southwest (-4.2%) while the largest rent decline for properties by unit are expected in the Northeast (-4.5%).
On the other end, the slightest rent decline for properties by bed are expected in the West (-1.8%) while the slightest rent decline for properties by unit are expected in the South Atlantic (-0.8%).
For properties that rent by bed, inventory is expected to grow by 2.4%, which would be the weakest growth recorded since at least 2014. While on the other hand, for properties that rent by unit, inventory is expected to grow by 1.2%, which would be largest growth recorded since at least 2014.
Source: Capital Trends US Apartment Q2 2021 by Real Capital Analytics September 2021
View previous Economic & Industry Updates here: https://www.naahq.org/previous-economic-industry-updates
