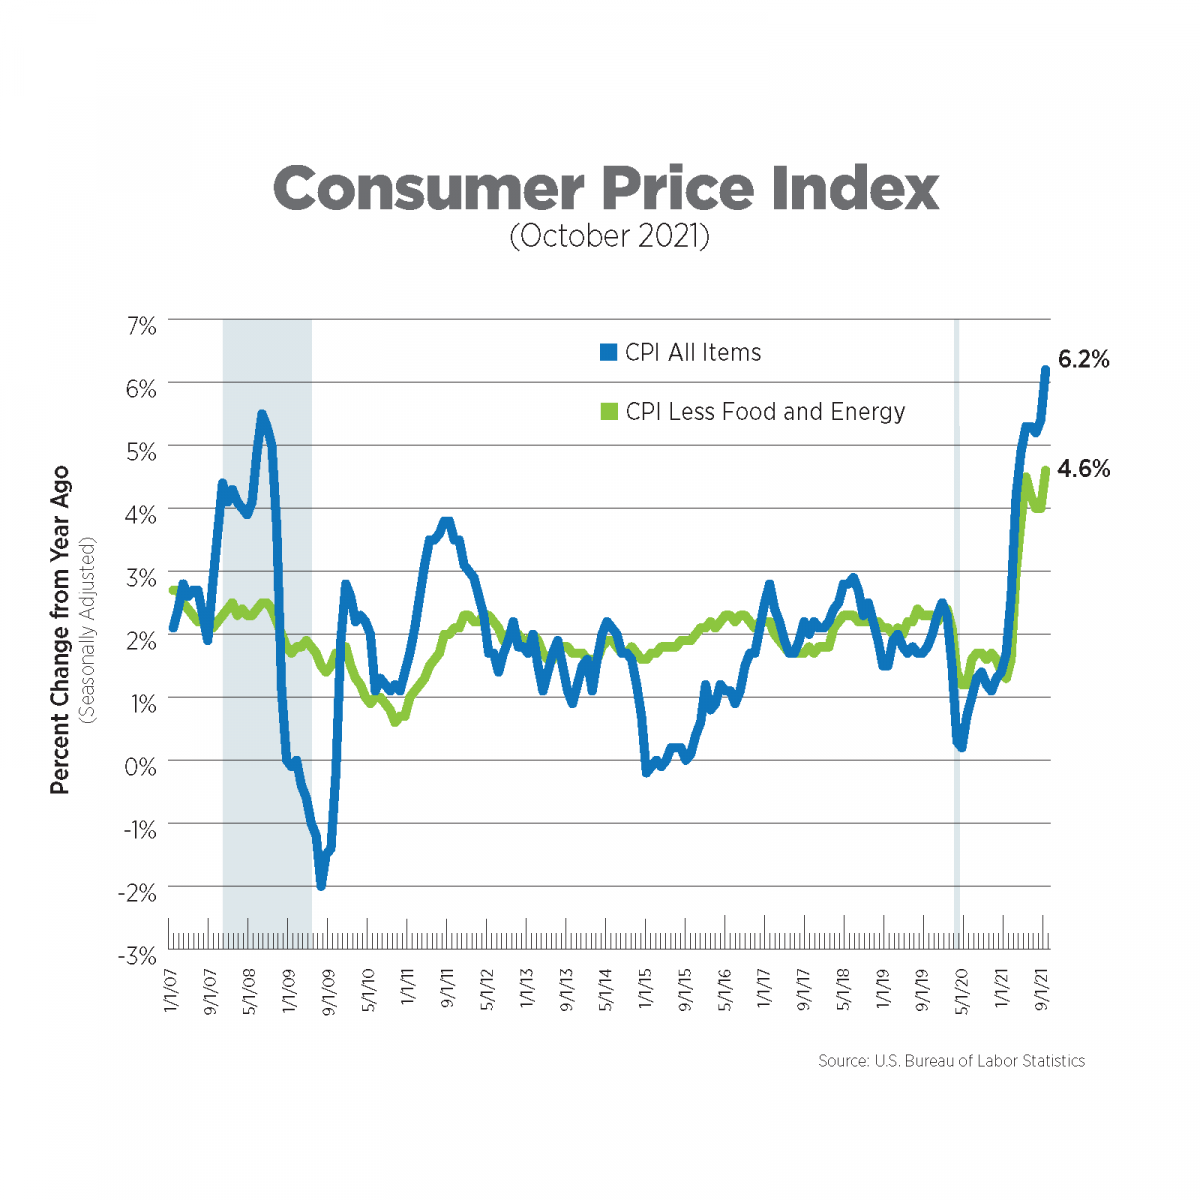
CPI, Latest Release, September 2021
The Consumer Price Index (CPI) rose 6.2% on a year-over-year basis, while prices excluding food and energy (core CPI) rose 4.6%, well above consensus forecasts. Energy prices have soared 30% over the past year while food prices were up 5.3%. For core CPI, used cars and trucks and new vehicles placed number 1 and 2 for price increases, 26.4% and 9.8%, respectively.
The Fed is watching the price of shelter closely as it is typically considered “sticky,” that is, not subject to high volatility and thus, a measure of longer-term inflation. The rent of primary residence rose 2.7% over the year while the owners’ equivalent rent of residences increased 3.1%. Owners’ equivalent rent is now just 10 basis points below its pre-pandemic 5-year average of 3.2% while rent of primary residence remains 100 basis points below typical price increases from 2015-2019.
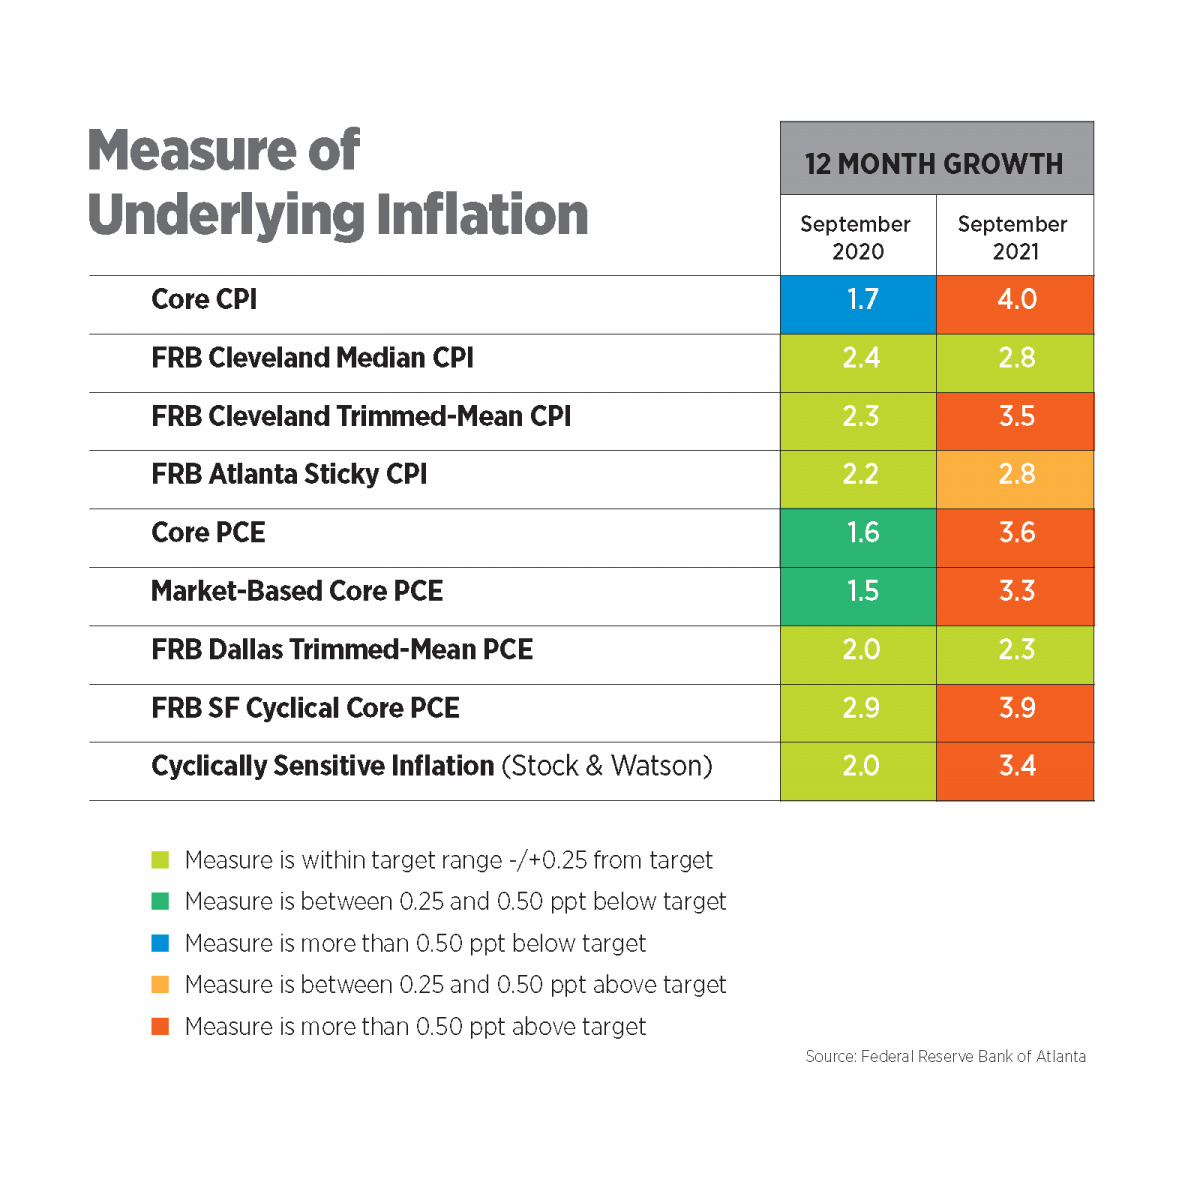
Alternative Measures of Inflation, September 2021
We have examined several alternative measures of inflation in prior Inflation Trackers, but the Atlanta Fed consolidates all of them into an Underlying Inflation Dashboard, updated monthly. Only two measures of inflation remained within their target ranges as of September: the Cleveland Fed’s median CPI and the Dallas Fed’s trimmed-mean PCE. This many underlying inflation measures above target played a big role in the Fed’s decision to start easing its bond purchases this month.
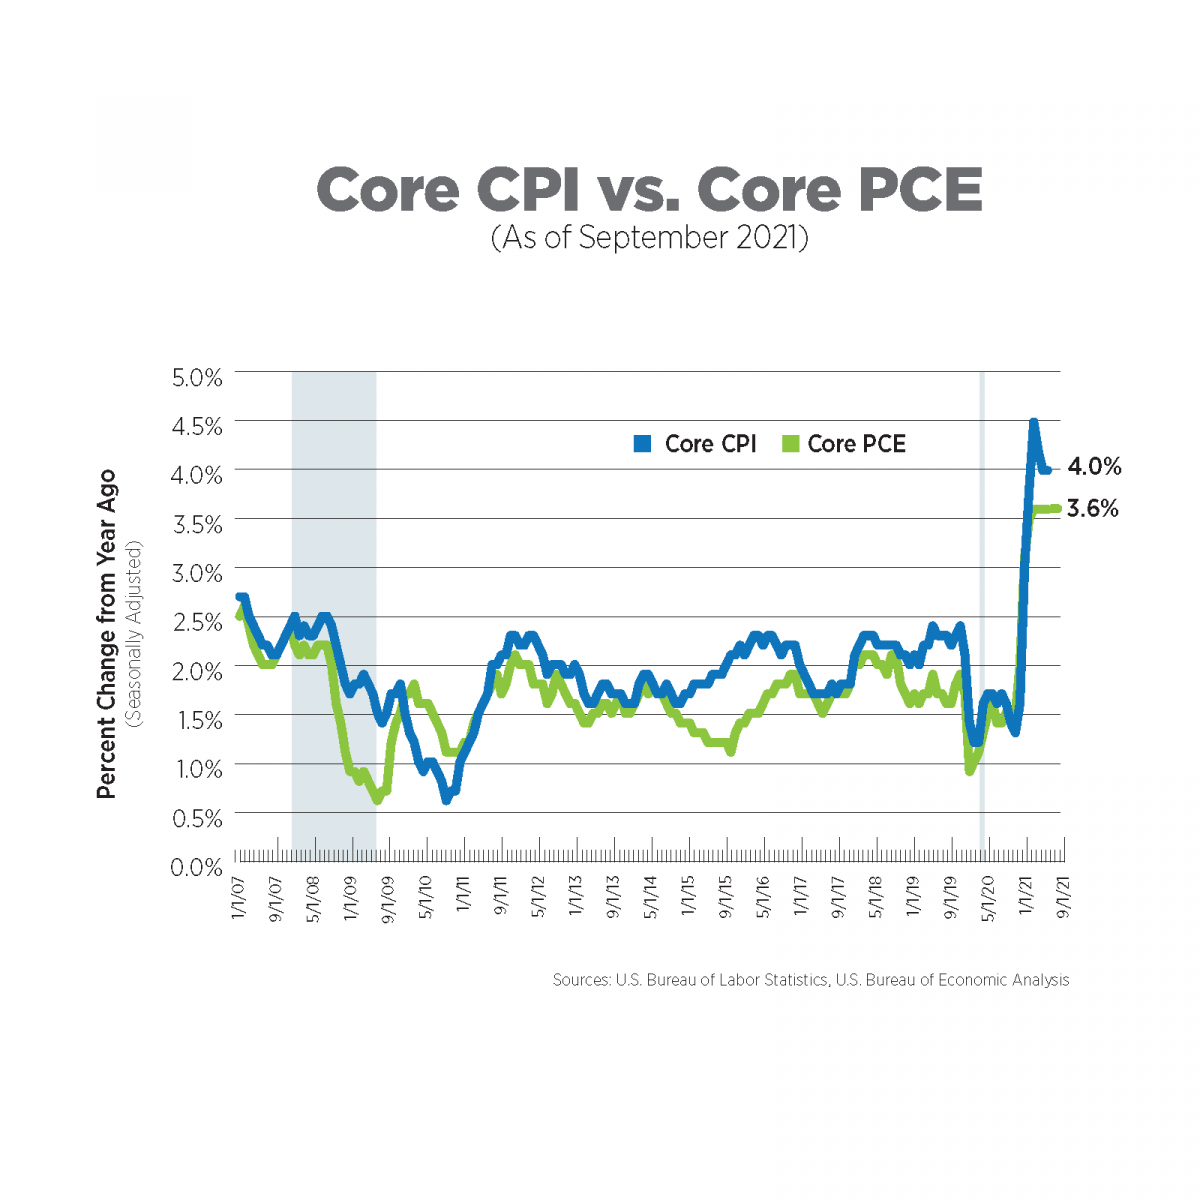
Alternative Measures of Inflation, September 2021
The Personal Consumption Expenditures (PCE) Index is the measure of inflation the Federal Reserve Bank uses in its policy decisions. It is produced by the Bureau of Economic Analysis and uses different formulas, different weights and has a different scope compared to the Bureau of Labor Statistics’ (BLS) CPI.
In September, core PCE increased 3.6 percent year-over-year for the fourth consecutive month, mainly driven by prices of durable goods, such as appliances, furniture and vehicles. In its meeting in early November, the Fed attempted to clarify the use of the word “transitory,” stating that it should not be linked to a specific timeline, but rather to the fact that the factors causing high inflation, such as supply constraints, will not be permanent nor persistently high. This month, the Fed begins lowering the level of its bond purchases to the tune of $15 billion per month. At that rate, the Fed would stop purchasing bonds altogether sometime in July 2022. It’s important to note that the Fed’s balance sheet is still far higher than pre-pandemic levels, having nearly doubled since that time to $8.6 trillion.
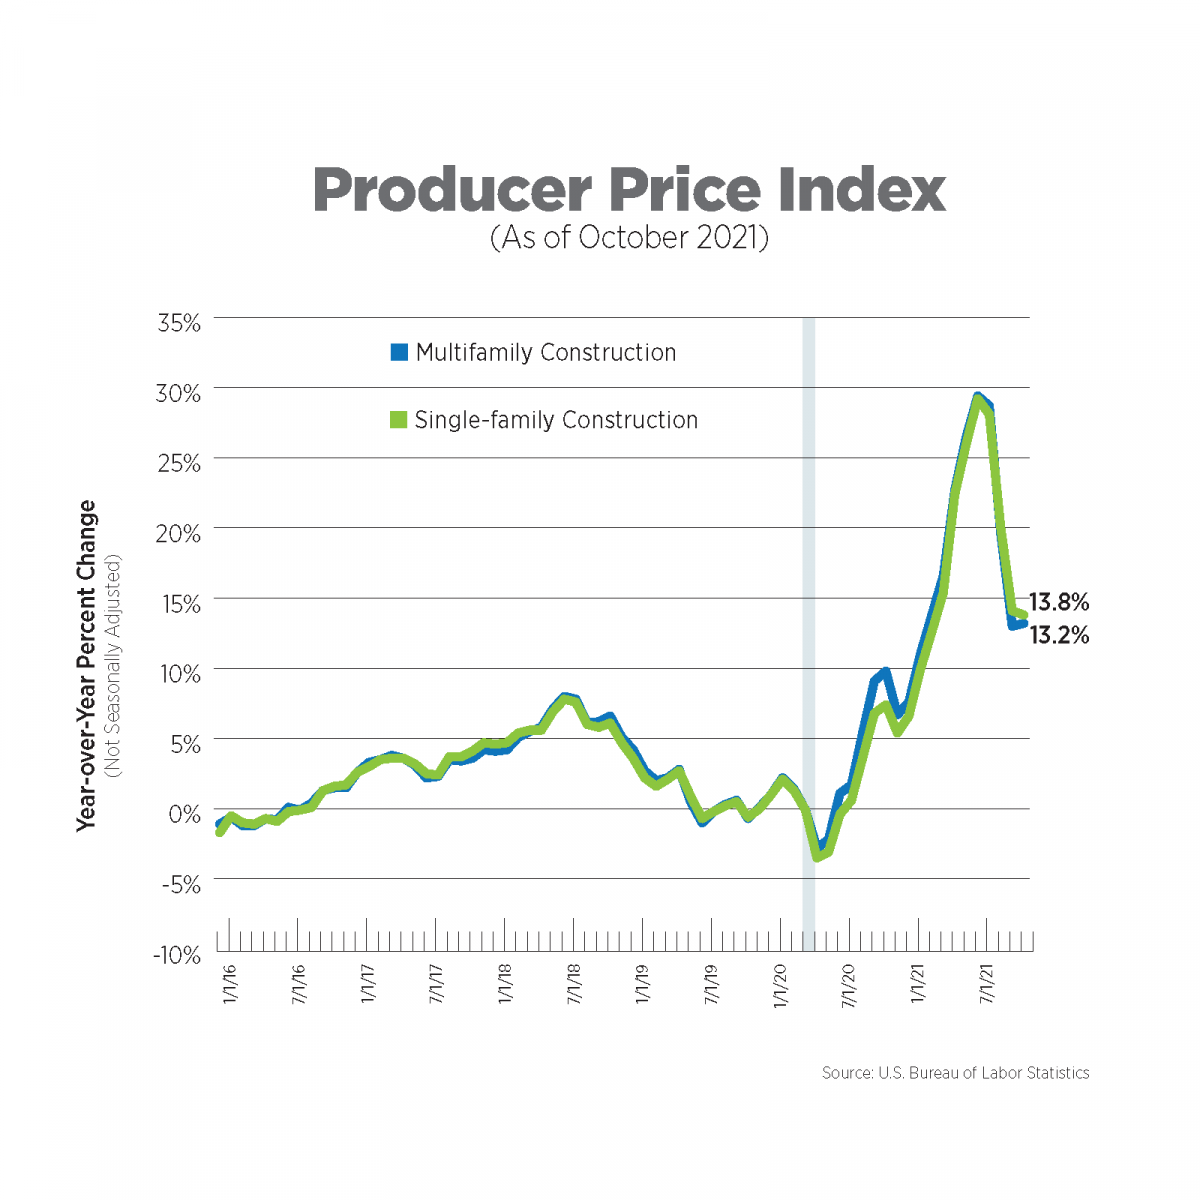
The Producer Price Index (PPI), October 2021
The Producer Price Index measures the change in selling prices for domestic producers of goods and services. It views price changes from a seller’s perspective unlike the CPI, which is based on purchasers’ experiences.
The BLS aggregates all construction inputs excluding capital investment, labor and imports for single-family and multifamily construction. October marked the tenth consecutive month for double-digit year-over-year increases for multifamily construction costs. Although price increases for both housing sectors moderated the last two months, they remained extremely elevated.
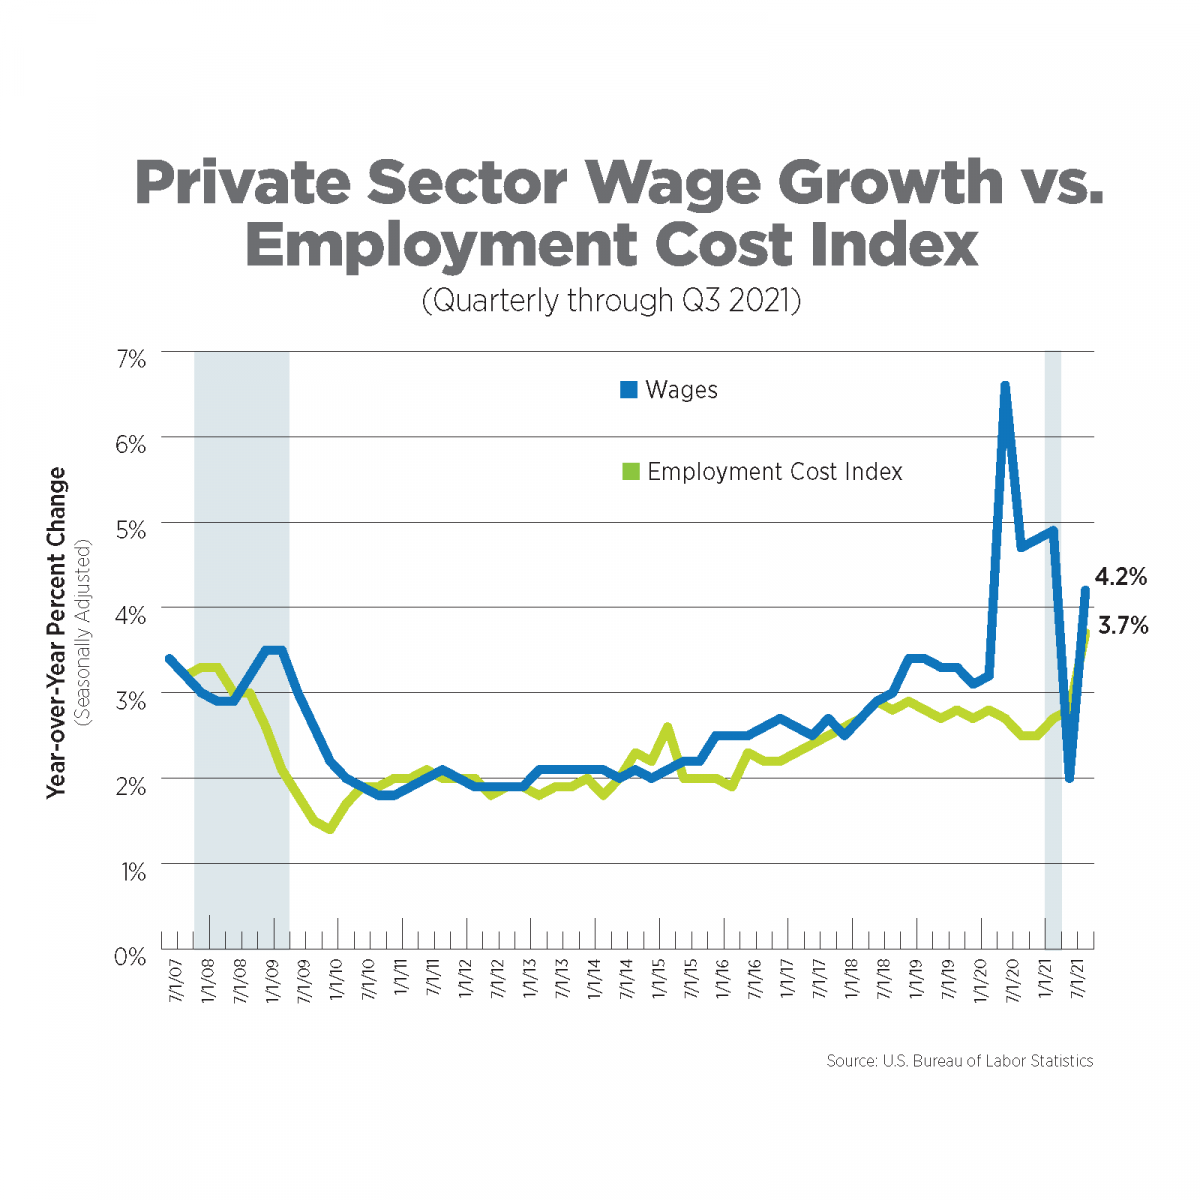
Wage Growth vs The Employment Cost Index, Q3 2021
The Employment Cost Index (ECI) is a quarterly measure of the change in the costs of labor. Unlike average hourly earnings, the series typically used for wage growth, the ECI calculation is not impacted by the change in employment levels among occupations and industries which can significantly skew wage levels. It also includes the costs of benefits to employers. The ECI is considered a purer measure of labor costs and is closely watched by the Fed.
Wage growth has been volatile but posted a strong average increase of 4.2% during the third quarter. The ECI surged 3.7% year-over-year, the highest increase since 2004. Wages and salaries increased 8.0 percent for workers at hotels and restaurants. By contrast, wages and salaries in the broader real estate and rental and leasing sector (including all property types and all rental businesses, in addition to multifamily) increased a modest 3.0%.
What to Watch in the Next Month
- The markets have already priced in Fed rate increases next year, but we will still be watching their reaction to the tapering. The Fed noted it will be monitoring the economy closely and will adjust the rate of bond purchases as needed. While flexibility is important in an economy that remains fragile, this statement also lends itself to uncertainty.
- Consumer expectations for inflation remain elevated and are weighing on confidence. Continued price pressures may keep consumers on the sidelines, resulting in weaker economic growth in Q4.
Next Tracker: December 13, 2021